[R Shiny] Visualize Data from the Synch Test #16
Description
Using the ReactionTimeSynchTests firmware we can capture people's ability to synchronize their button inputs to either a blinking LED or a vibrating ERM. We are sending this data to a synch_test table inside the database.
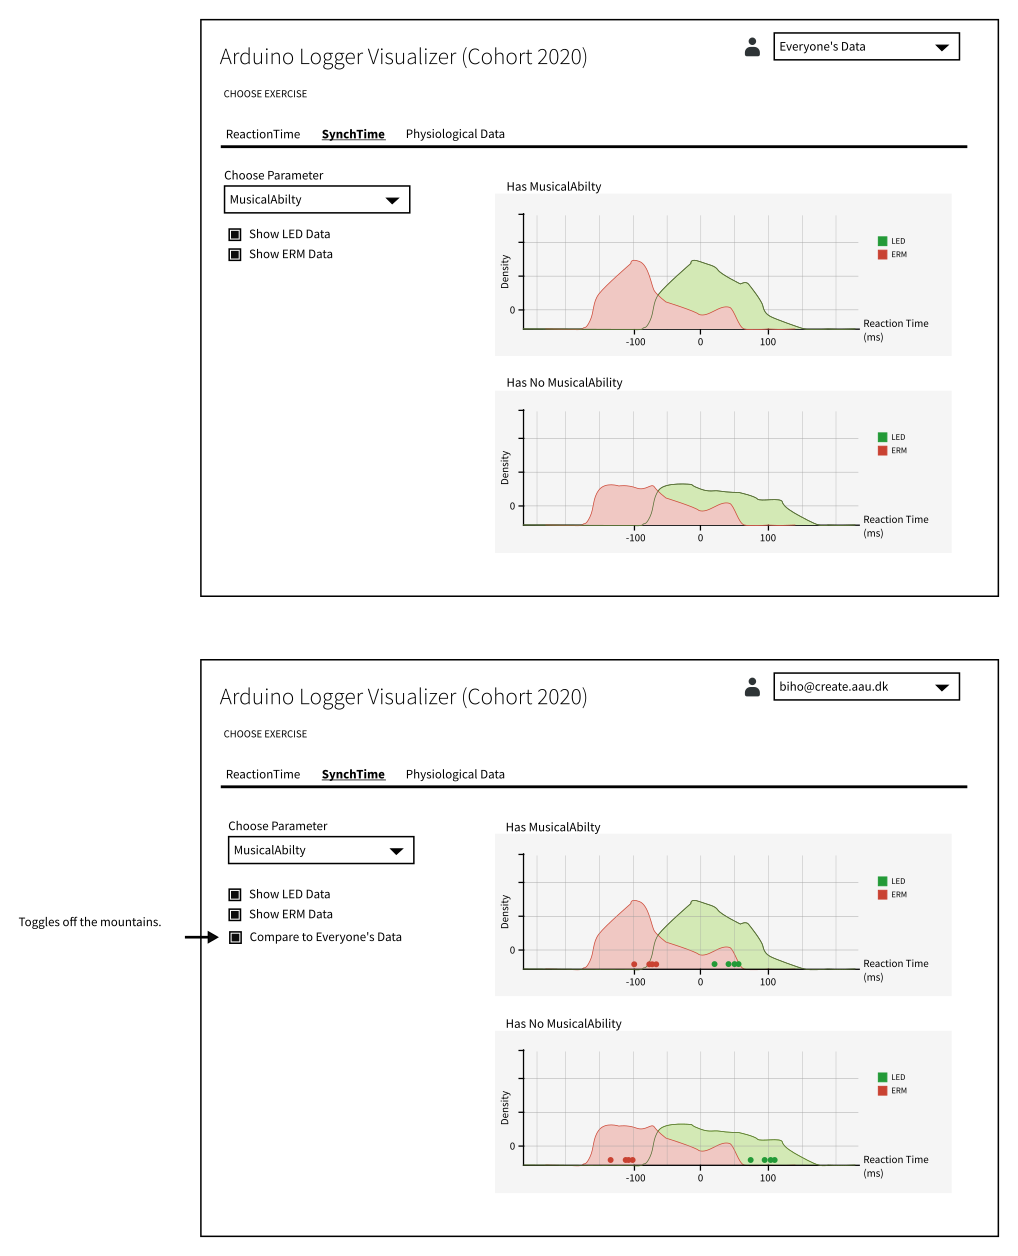
This makes it possible to create visualizations of people's ability to press buttons in synchronization to a stimuli, with R Shiny. See the mockups below, for how the SynchTest visualizations could look like.
Extra notes:
- The "Choose Parameter" is a dropdown which filters between all possible comments people have entered. (MusicalAbility is an example of such a comment). When one comment is chosen, it is compared to all data which does not have this comment.