For this project, you work with the data files provided in the "Names" folder in the files section. These files contain national data on the relative frequency of given names in the population of U.S. births where the individual has a Social Security Number. For each year of birth YYYY after 1879, there is a comma-delimited file called yobYYYY.txt. Each record in the individual annual files has the format "name,sex,number," where "name" is 2 to 15 characters, "sex" is M (male) or F (female) and "number" is the number of occurrences of the name. Each file is sorted first on sex and then on number of occurrences in descending order. The following creates an application that will show how often a certain name has been used throughout history in the United States, up to year 2020.
The program will analyze the given data to feed a graphical user interface created in MATLAB. The program does the following:
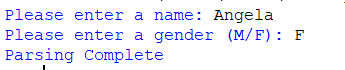
- Ask the user for a desired name and a sex.
- Go through all the data files and find how many times the user-given name has been used for the user-given sex each year.
- Calculate the popularity of the user-given name per year as a percentage of the total number of name occurrences used per year.
- Find the best linear fit to the name occurrence data using the least squares method. This should be done for both the absolute number of occurrences and the popularity percentages.
The results will be saved in txt format and will be used for part 2.
The least squares linear fit approximates a set of (x,y) data as a straight line. This method is based on minimizing the error between the actual data points and the line one gets using the calculated values of m and b. To use the least squares method assume that each of your x values is called xi and each of your y values is called yi, so that a single data point is (xi, yi). The counter i goes from 1 to n, which is the number of data points you have.
You can define average x and y values:
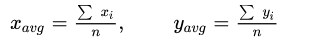
These values to determine m and b:
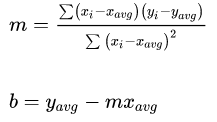
In our case, the values xi represent years, while the values yi represent either name occurrences or name popularity for each year.
The program does the following:
- Import the text data into MATLAB.
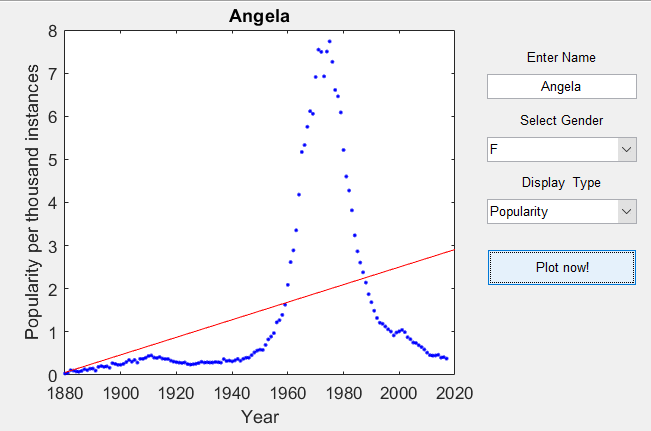
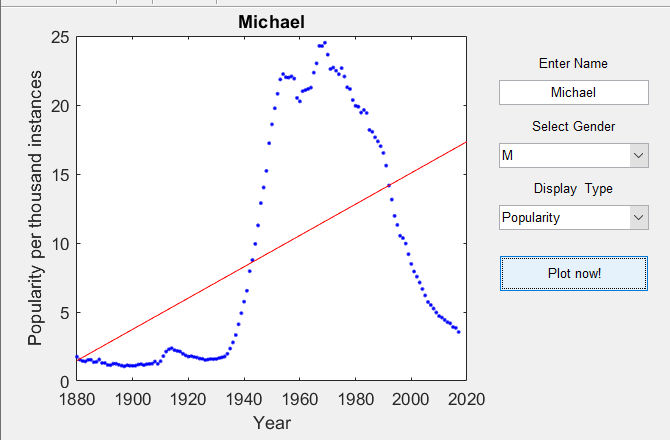
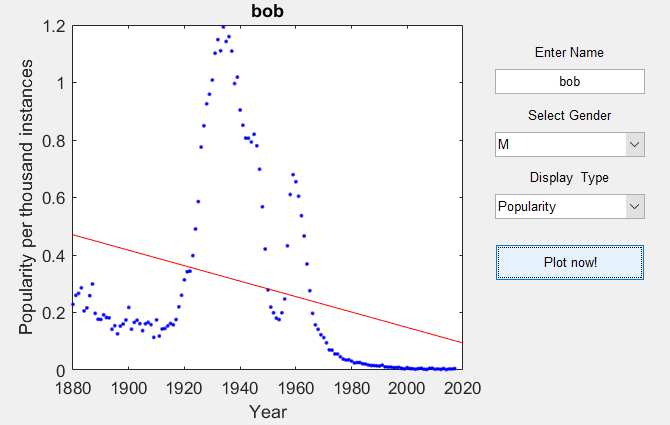
- Create a GUI that will show the historic occurrences of the user-given name over time. Your GUI should include a plot of name occurrences (y-axis) vs year (x-axis) as well as buttons (or drop-down menus, or checkboxes, or any other control structure you prefer) to choose whether to plot the absolute number of occurrences or the popularity percentages.
- Plot the appropriate least squares fit line on top of the historic data.
After running the code, a program where you type in the name and select their gender will appear. You click "Plot now!" to plot the popularity of your name. Have fun :)! In MATLAB, the GUI should be able to refresh whenever the user selects to plot absolute number of occurrences or the popularity percentage.
Use Python first, then MATLAB. Made with names folder relative to this:
os.getcwd() + "/Names/" + filename