![]()


![]()


Welcome! This project is designed for use with the Numworks graphing calculator. It allows you to add graphical functions, mainly around new drawing functions like line or circle drawing, but also mathematical classes like vectors or points, and much more!
But it's also an easy-to-use library available on PyPi, so you don't have to code on your calculator, thanks to the Numworks python emulator for computers.
I recommend that you test the example files on your own computer, as you can drastically increase their execution speeds.
To install it on the Numworks, we have the choice :
-
Just follow this link to the Numworks website
-
You just need to copy and paste the code from the visual file into a new script on your Numworks account. Then upload it to your calculator.
Here's another example of what you can do with the functions provided by Visual.

If you have any questions, go to the FAQs section, or explore all the examples here after visiting this page to install the visualcore library on your computer !
- Simply use this command :
pip install visualcore- Or download the github repository in .zip or clone it via this url :
https://github.com/Archange-py/Visual.gitTo use it properly, you need to install several python packages on your computer, either from the command line using the requirements.txt file :
pip install -r requirements.txtOr individually with each package.
pip install kandinsky- Ion :
pip install --pre ion-numworksAnd python, of course, here if you don't already have it.
You can change the emulator's OS by pressing "CTR+O" to increase speed, so you can get the most out of it without seeing everything slow down !
First of all, after you're on your computer, you need to start by importing it after installing it in the current directory, and write that on the first line of your project :
from visual import *After that, you need to understand how this script is organized, with points and vectors for example, and how it works, with its functions. For this purpose, you have at your disposal one Jupiter Notebook containing everything that can be shown in writing for the file visual_example.
Here's an example of what you can do with the calculator, using the compact example file. Click here to see it on the Numworks website.
from visual import *
A = Point( 20, 20, 'A')
B = Point(160, 111, 'B')
C = Point( 20, 202, 'C')
D = Point(300, 20, 'D')
E = Point(300, 202, 'E')
F = milieu(D, E)
F.round()
F.name = 'F'
V = Vector(A, B, name='V')
W = Vector(B, C, name='W')
Y = Vector(F, D, name='Y')
X = Vector(F, E, name='X')
U = V + W
U.name = 'U'
def example():
draw_points([A, B, C, D, E, F], 'r', style='.')
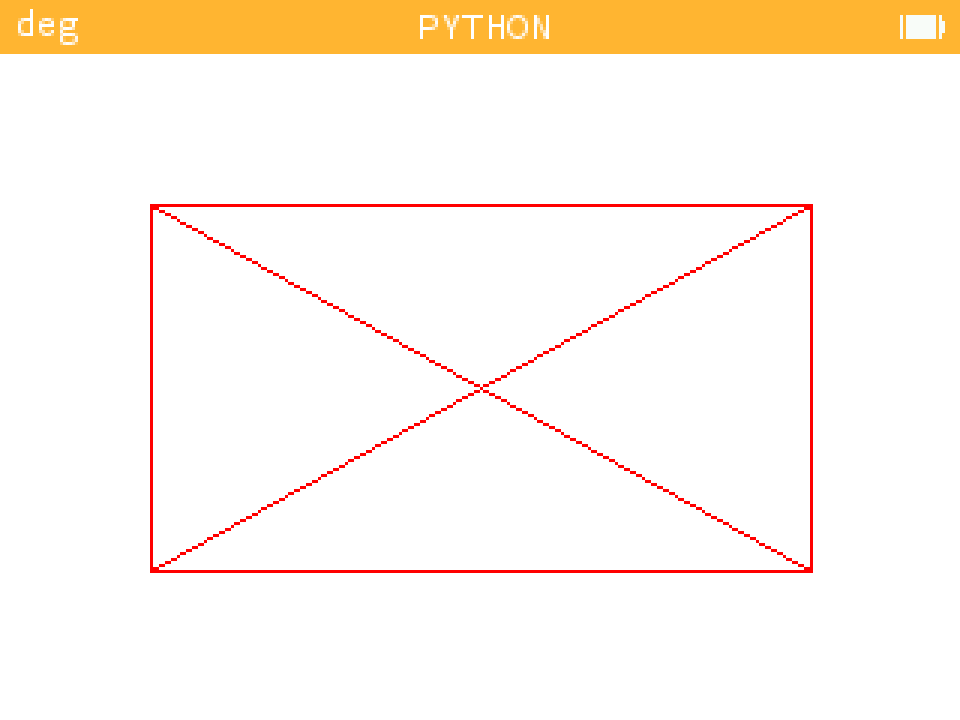
draw_rectangle(A, E)
draw_croix(B, 320)
bezier_curve([A, B, C, E], 'orange')
bezier_curve([E, B, D, A], 'orange')
draw_circle(B, 50, 'r')
fill_circle(B, 10, 'r')
draw_droite(D, E, 'cyan', "d'")
draw_droite(D, B, 'cyan', "d''")
draw_droite(E, B, 'cyan', "d'''")
draw_vector(A, V, 'g')
draw_vector(B, W, 'g')
draw_vector(A, U, 'g')
draw_arrows([(F, D)], 'b', fill=True)
draw_arrows([(F, E)], 'b', fill=True)
draw_polygone(6, 50, B)
fill_polygone(6, 50, B, 'yellow', alpha=0.5)
example()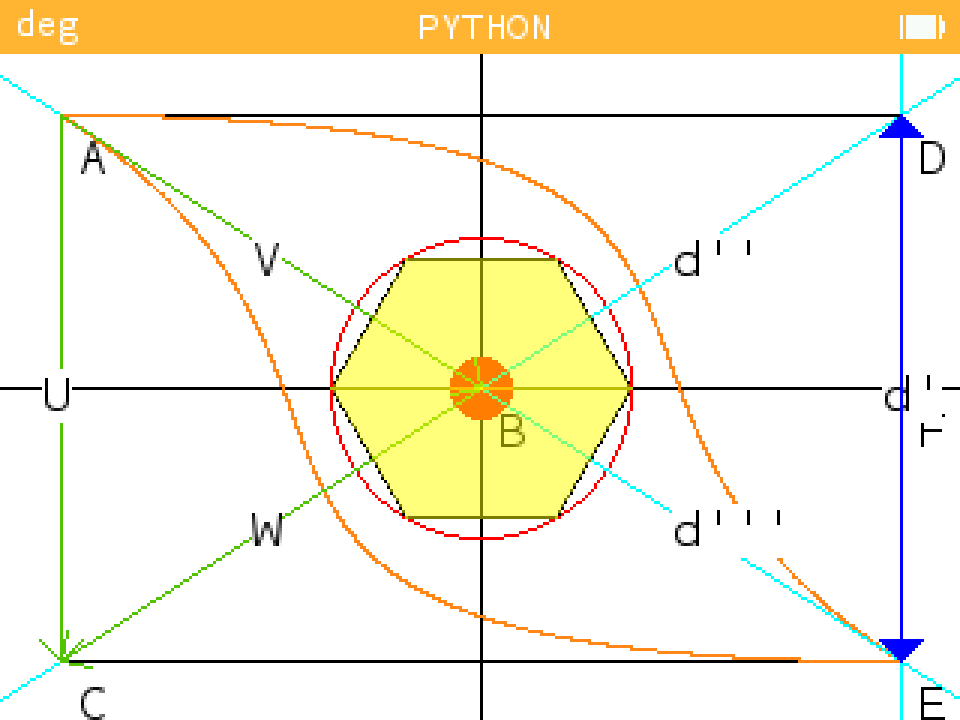
Then there are plenty of example files for everything to do with graphics. You can see the results with the following images :
- Function interpolation : example_interpolation.py
| Example 1 | Example 2 | Example 3 | Example 4 |
|---|---|---|---|
 |
 |
 |
 |
-
Function expend : example_vectoriel_geometry
-
Function findWithPoint : example_findwithpoint.py
-
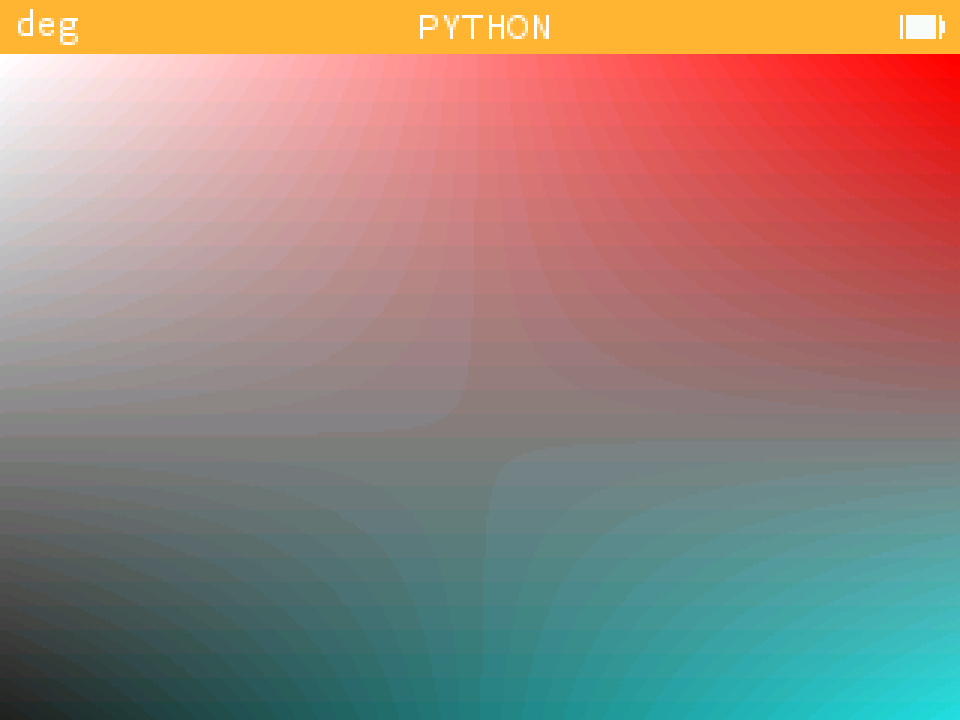
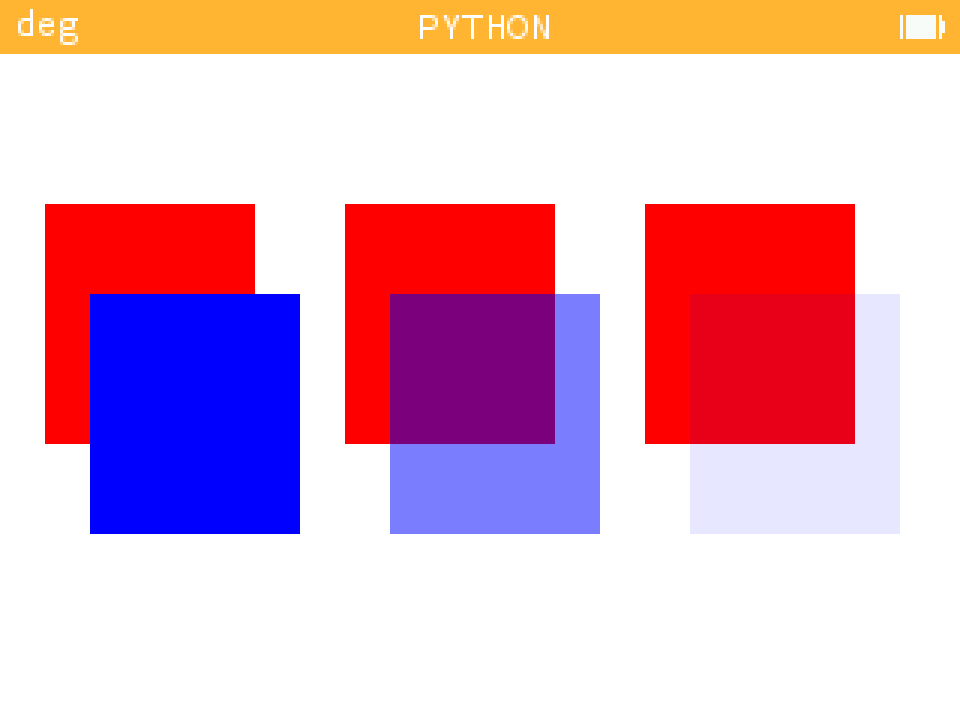
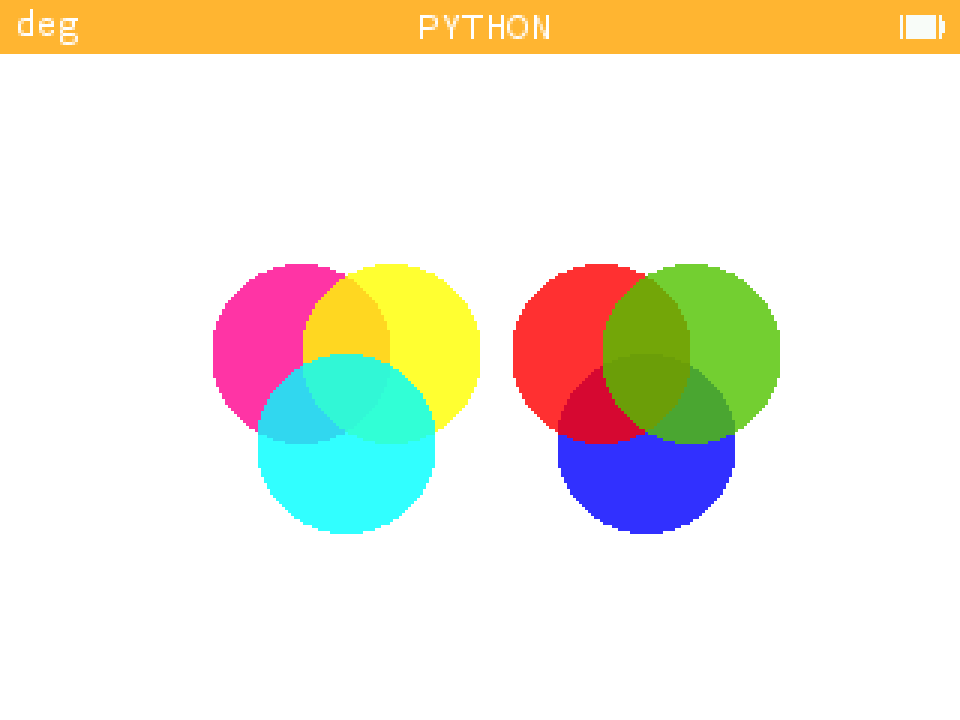
Function alpha_pixel and argument "alpha" in draw function : example_alpha_layer.py
We have to take a number less or equal to 0, and greater or equal to 1 for the alpha parameter
| Example 1 | Example 2 |
|---|---|
 |
 |
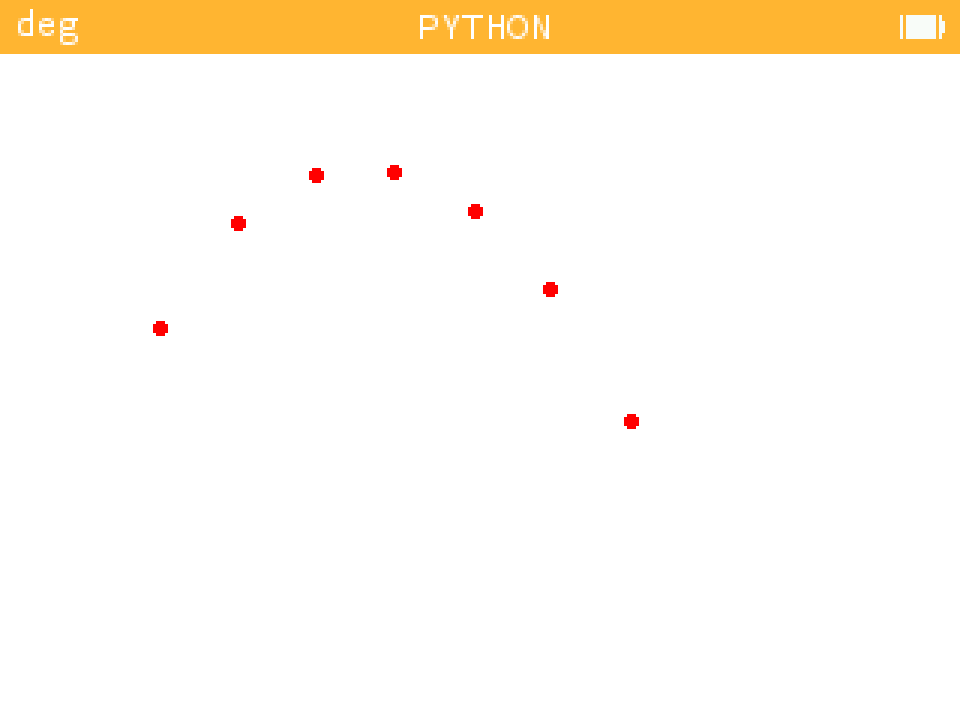
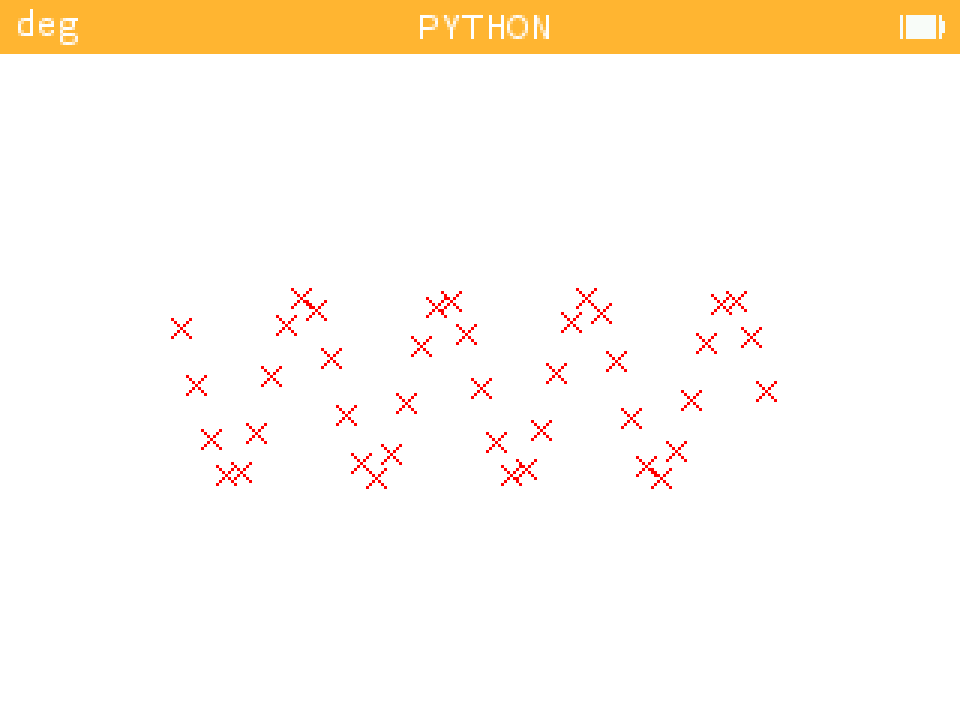
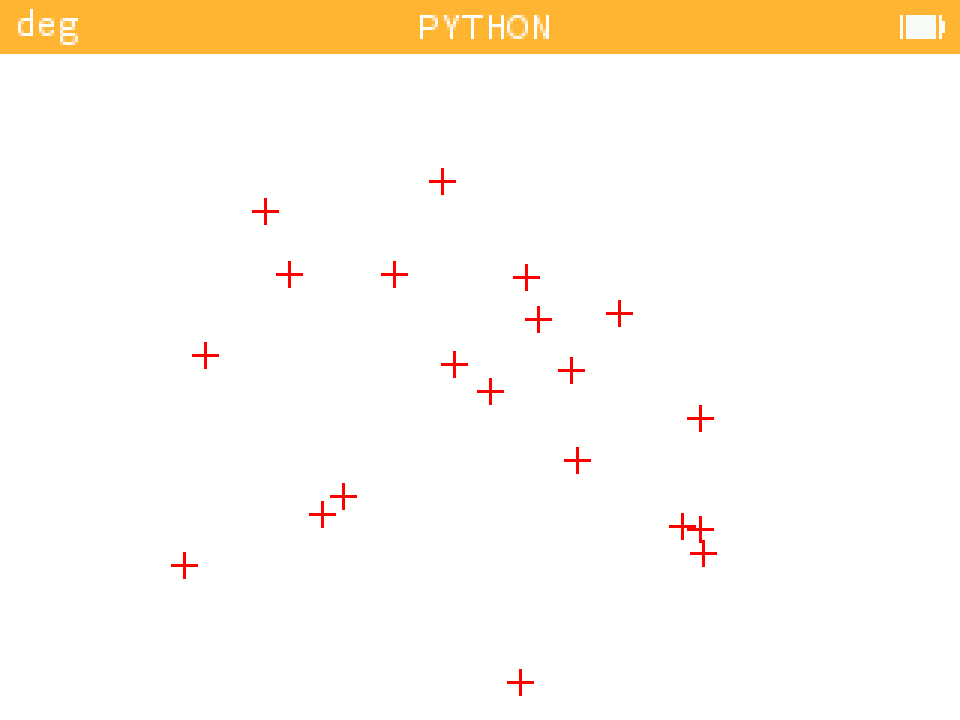
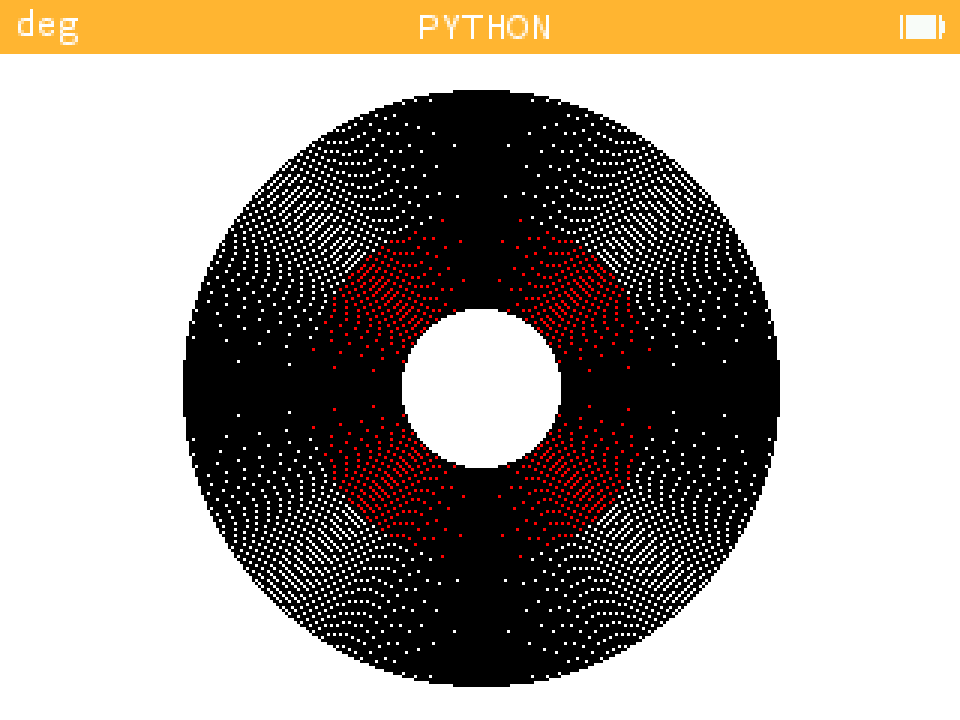
- Function scatter : example_scatter.py
| Example 1 | Example 2 | Example 3 |
|---|---|---|
 |
 |
 |
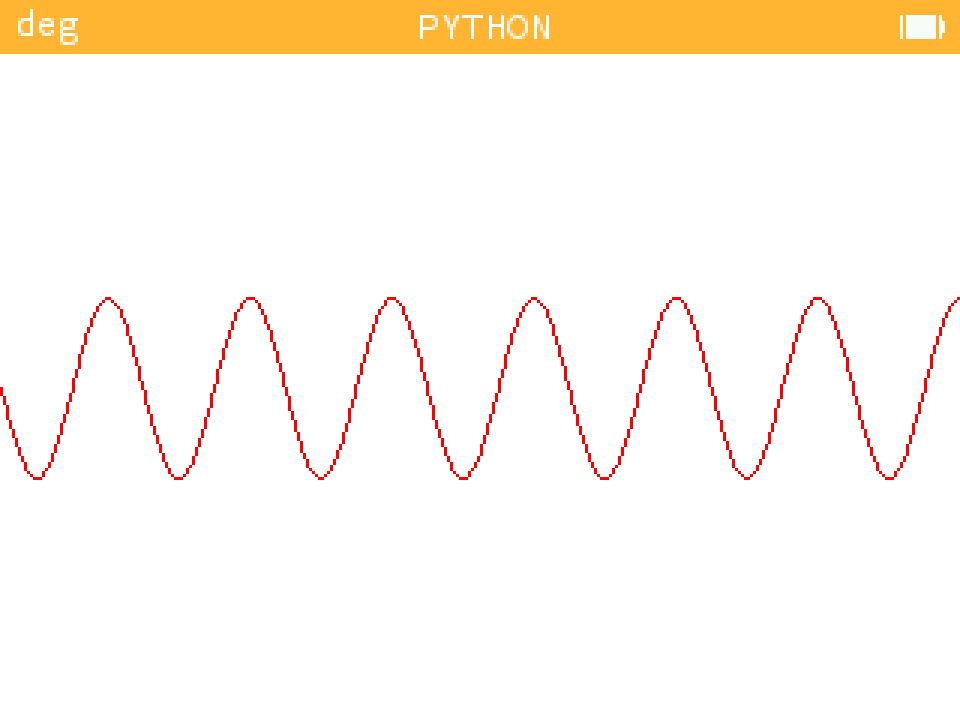
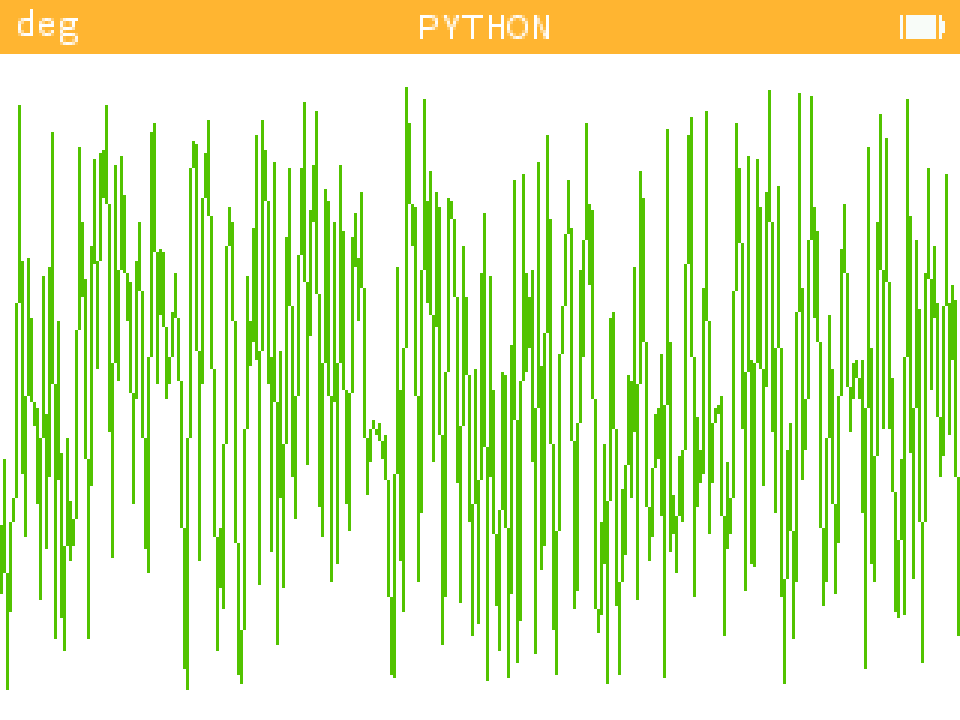
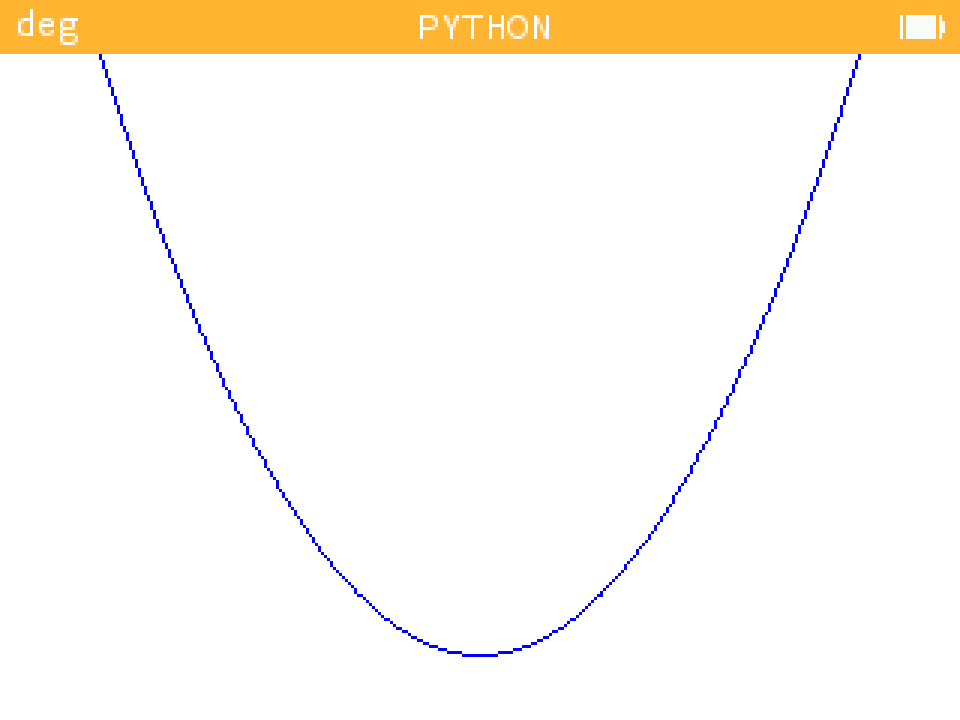
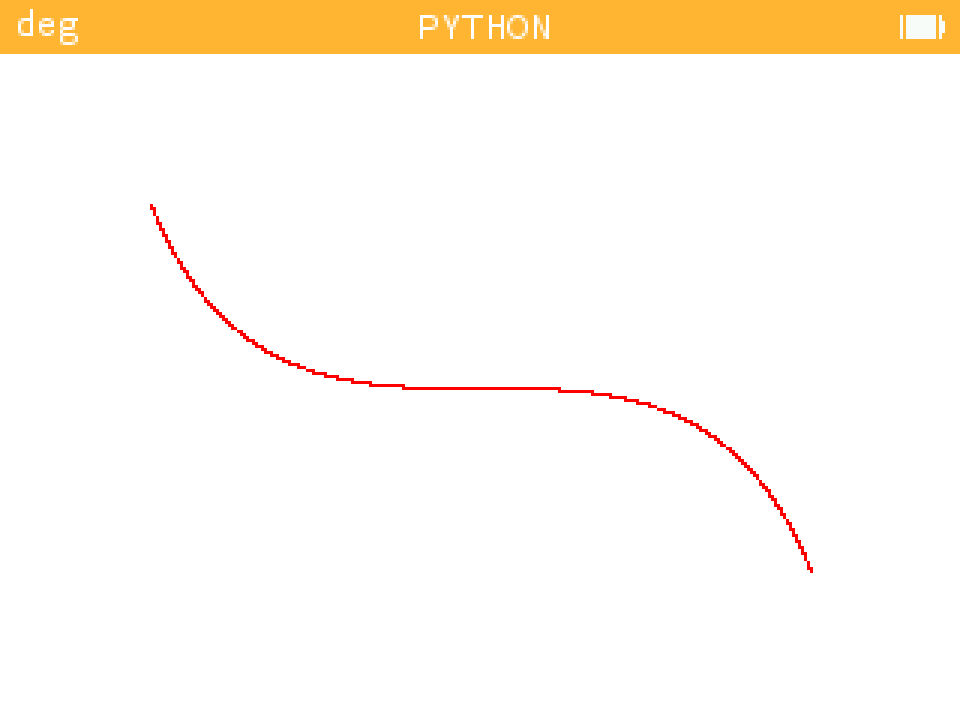
- Function plot : example_plot.py
| Example 1 | Example 2 | Example 3 |
|---|---|---|
 |
 |
 |
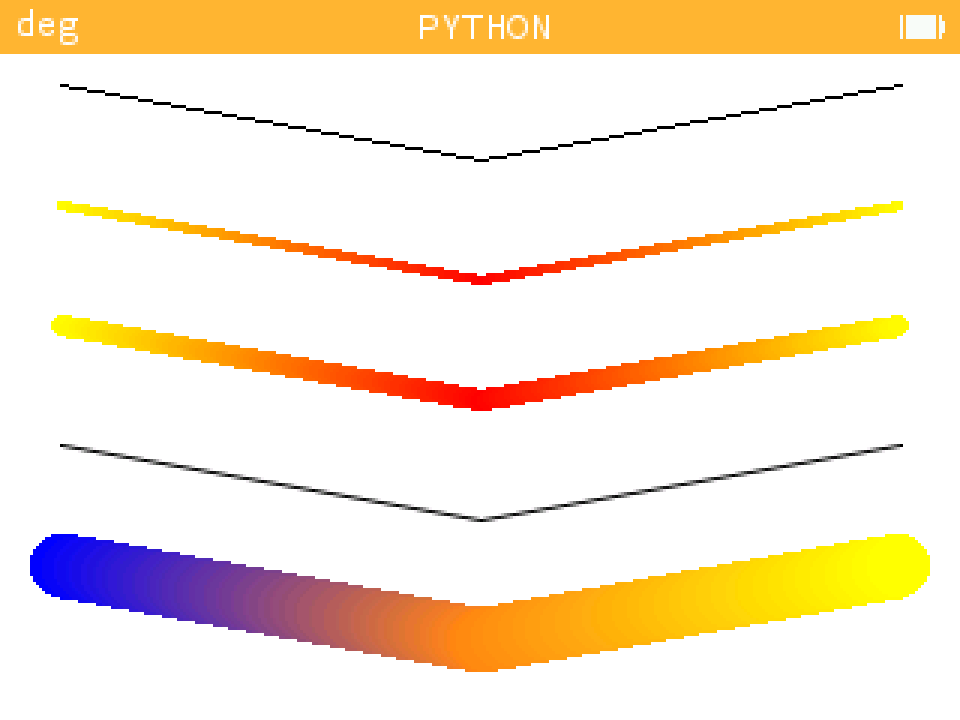
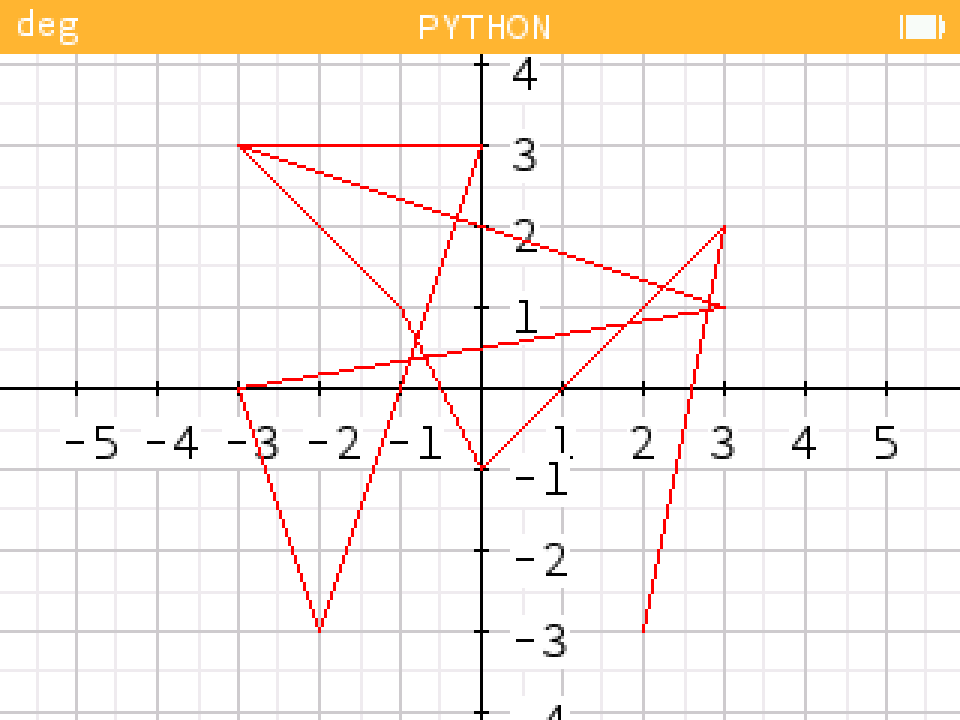
- Function set_lines : example_lines.py
| Example |
|---|
 |
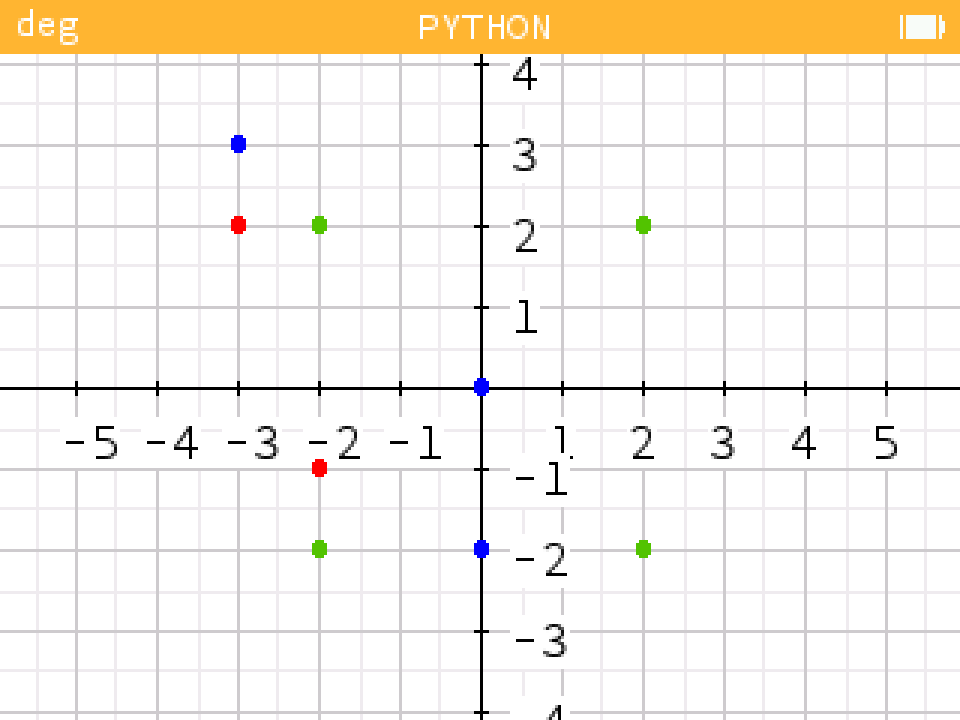
- Function draw_points : example_point.py
| Example |
|---|
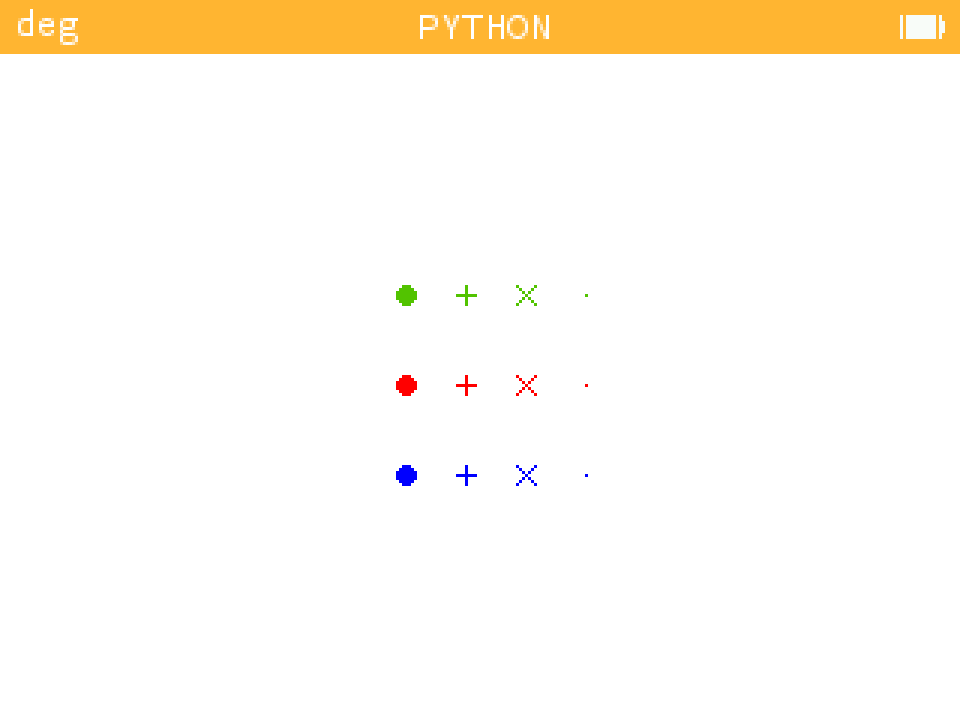 |
- Function draw_croix : example_croix.py
| Example |
|---|
 |
- Function draw_arrows : example_arrows.py
| Example |
|---|
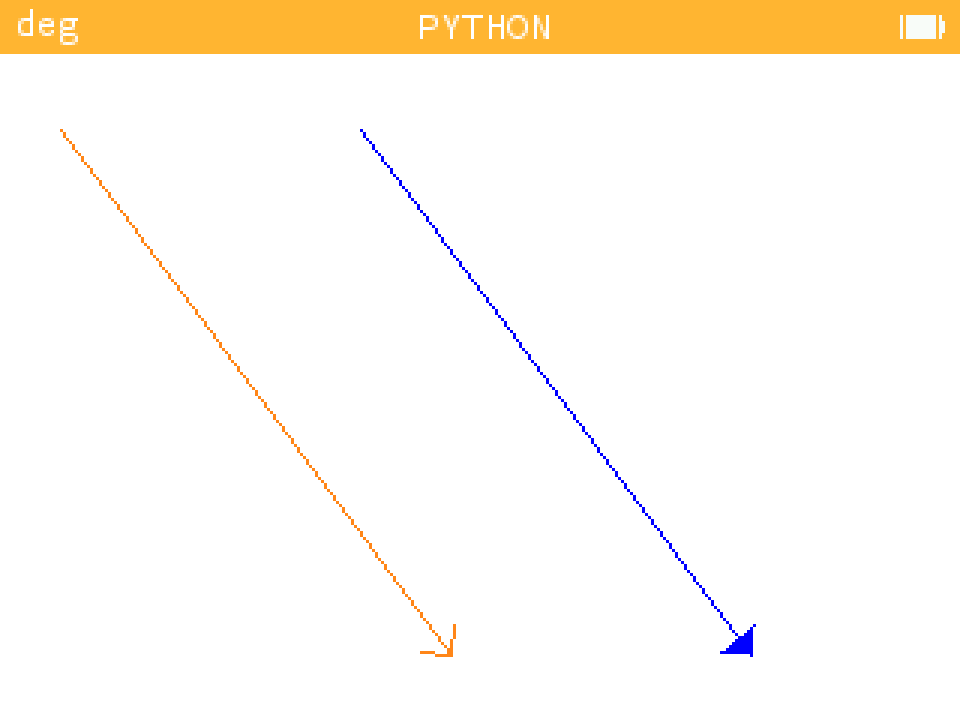 |
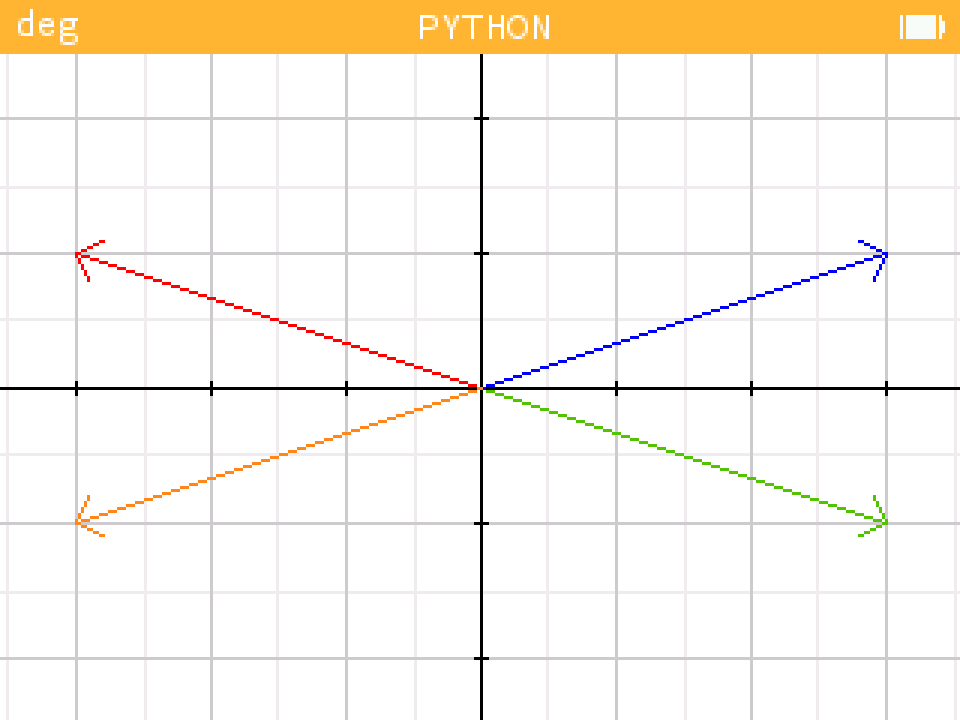
- Function draw_vector : example_vectors.py
| Example |
|---|
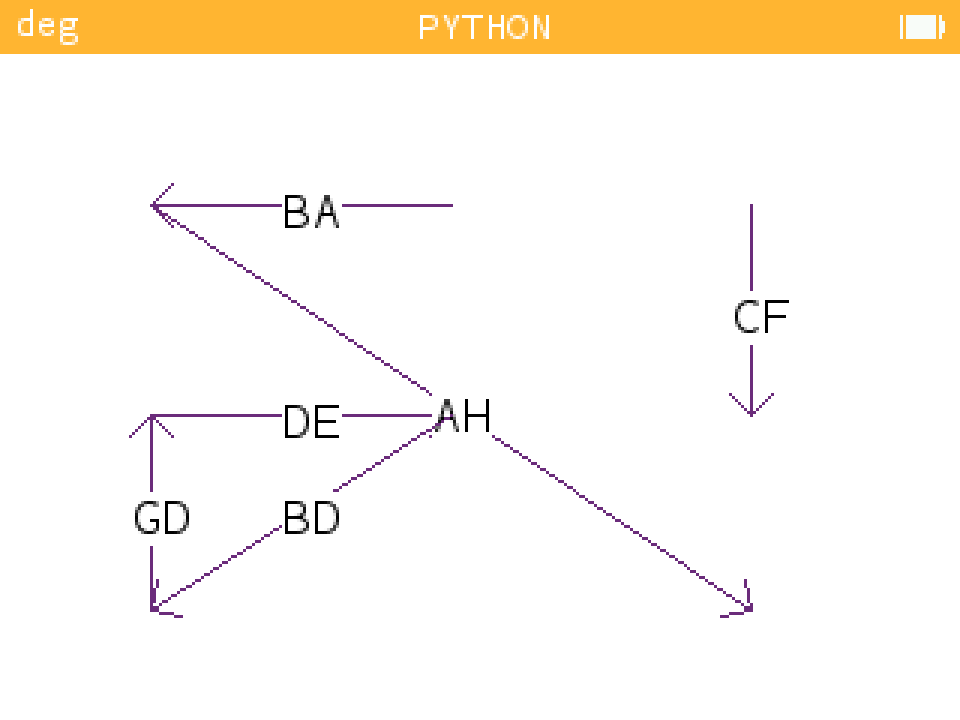 |
- Function draw_droite : example_droite.py
| Example 1 | Example 2 |
|---|---|
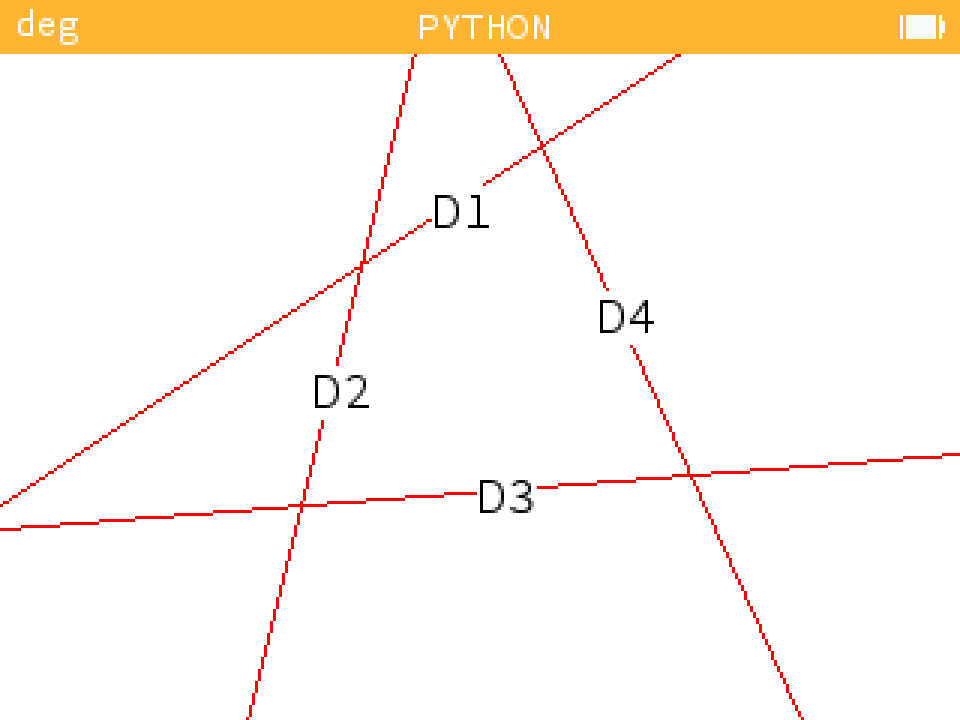 |
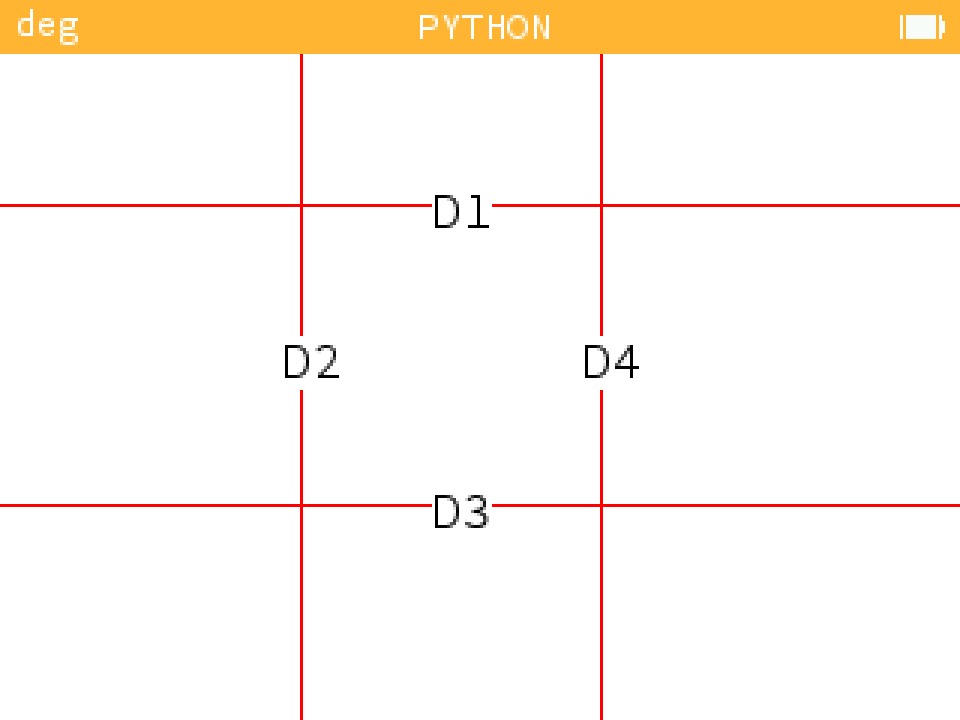 |
- Function fill_triangles : example_triangle.py
| Example |
|---|
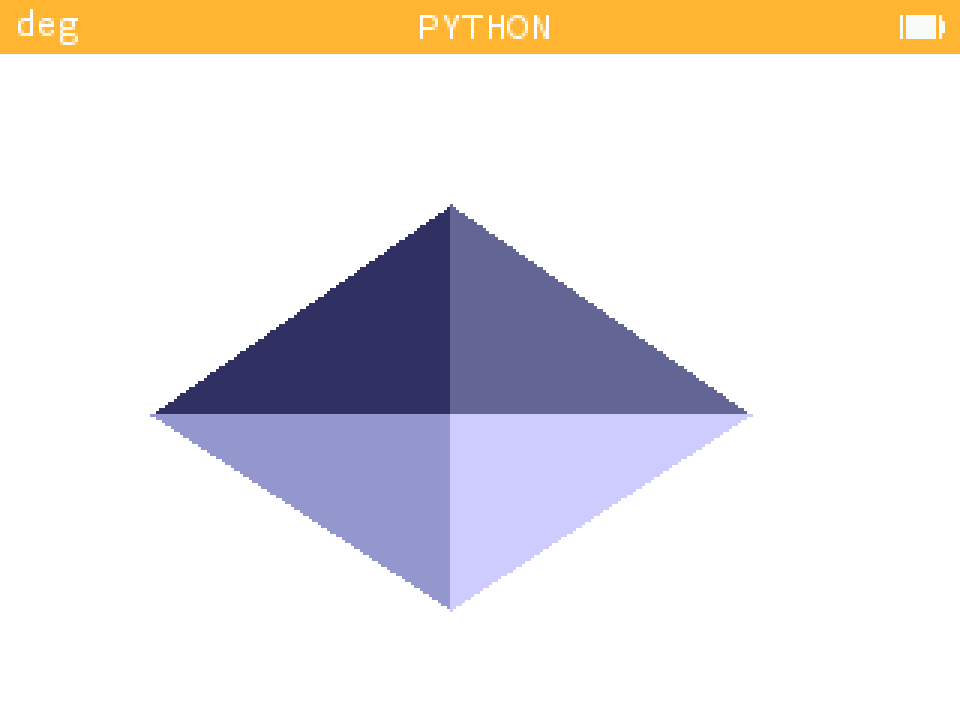 |
- Function draw_polygone and fill_polygone : example_polygone.py
| Example |
|---|
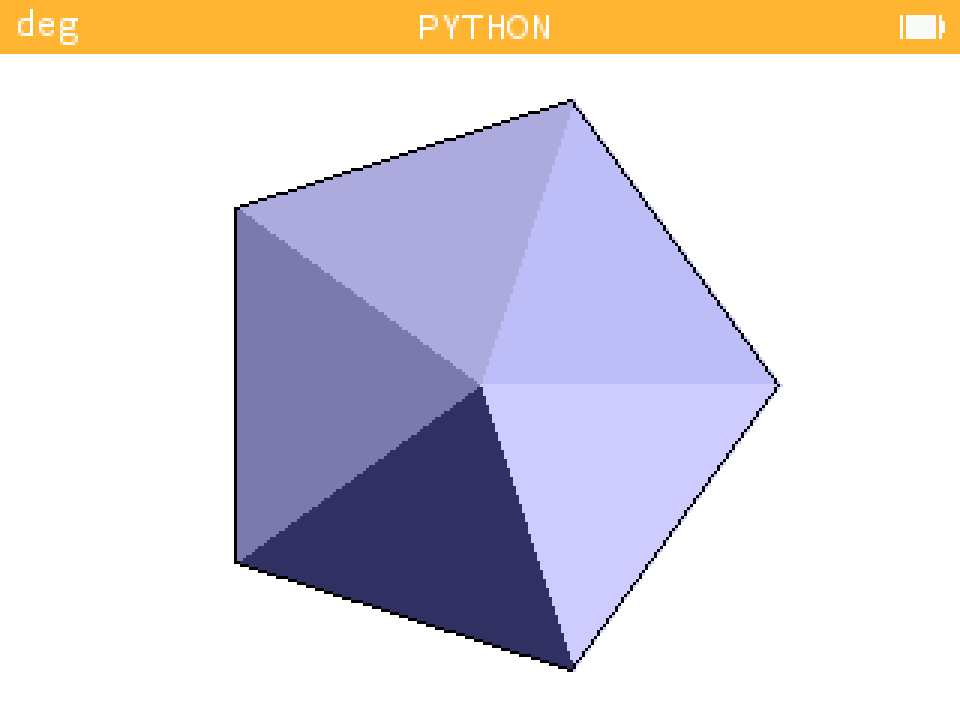 |
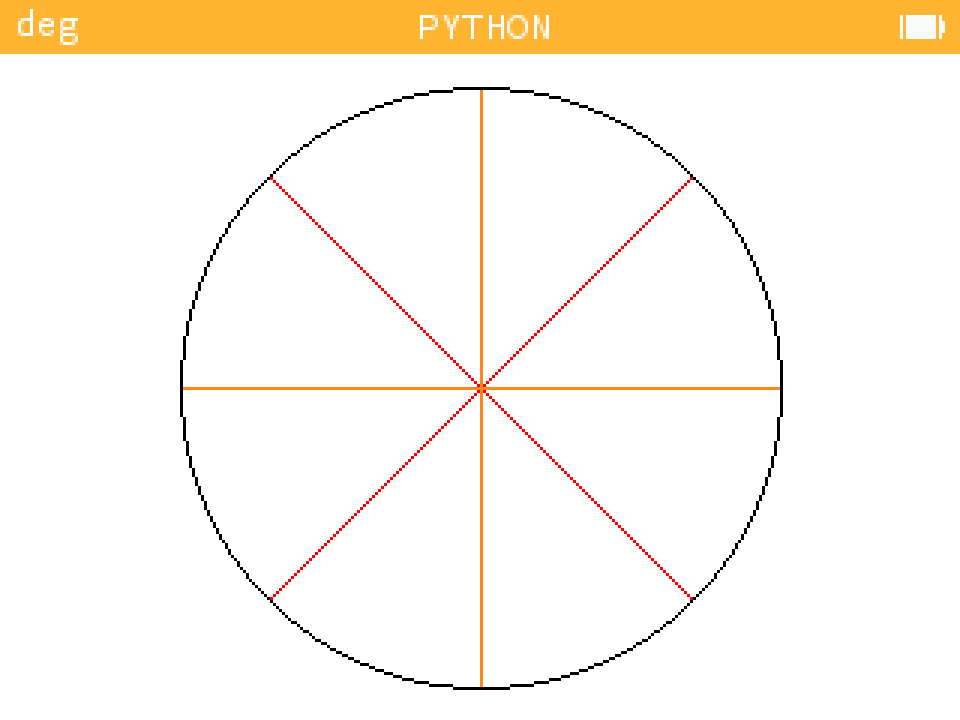
- Function draw_circle and fill_circle : example_cercle.py
| Example |
|---|
 |
- Function bezier curve : example_bezier_curve
| Example 1 | Example 2 |
|---|---|
 |
 |
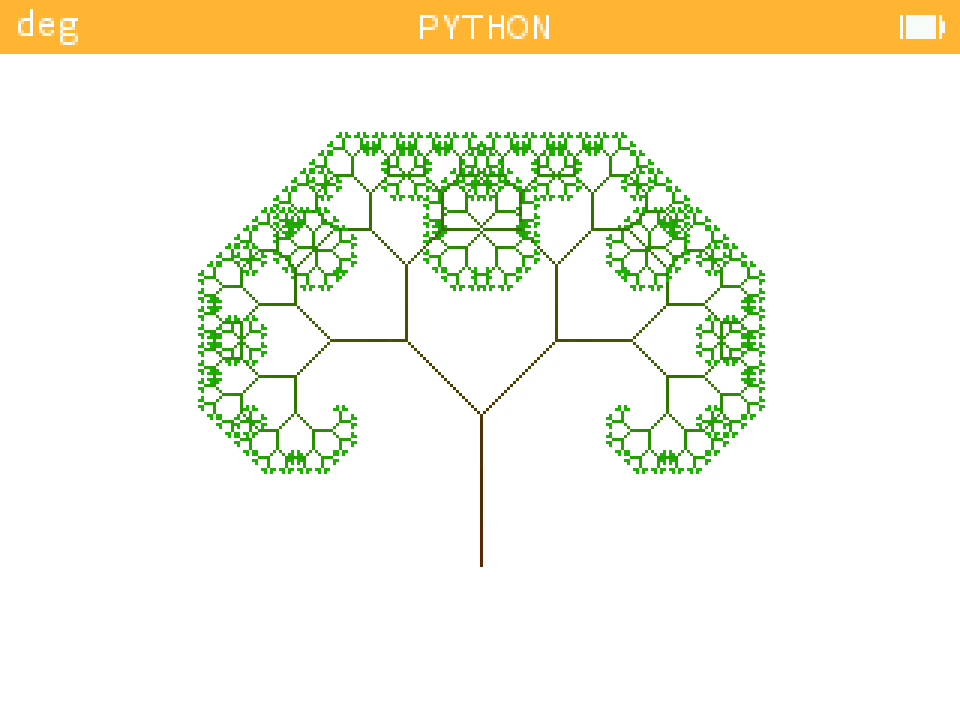
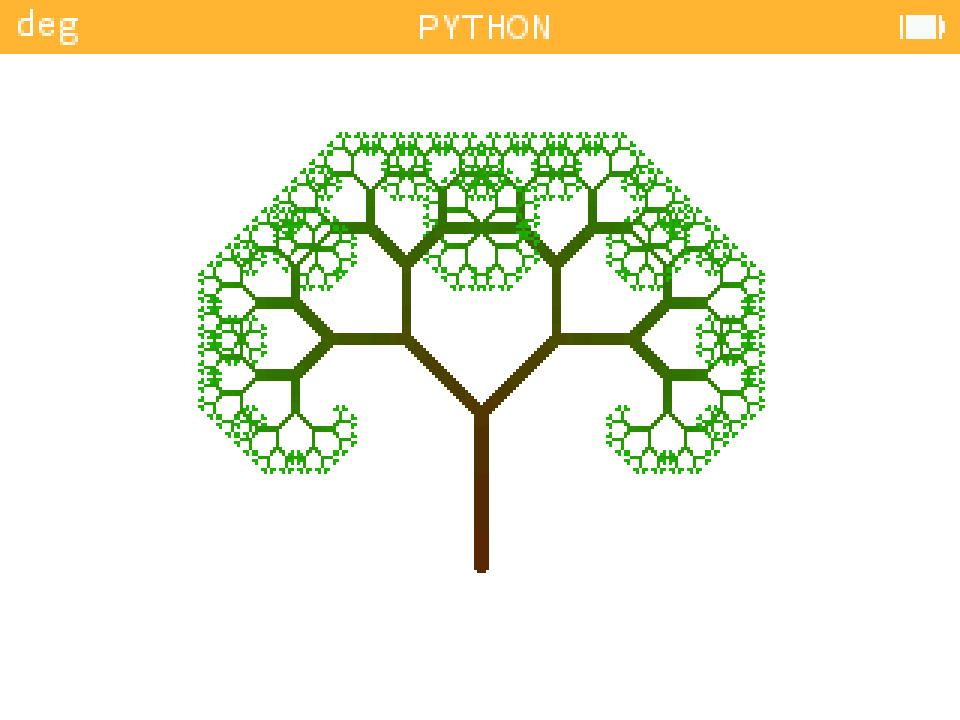
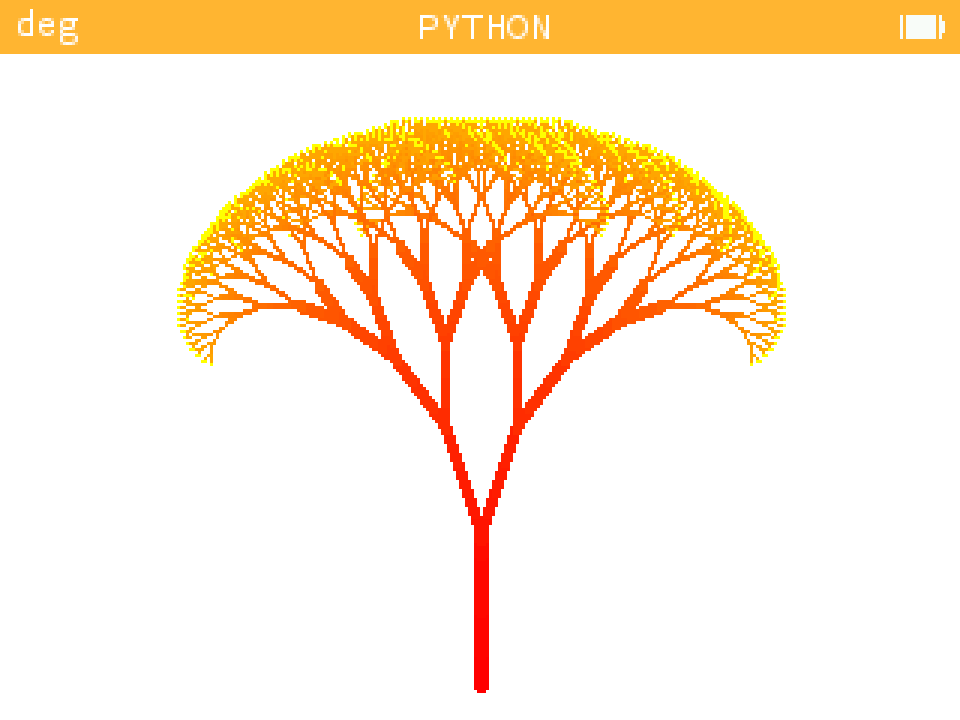
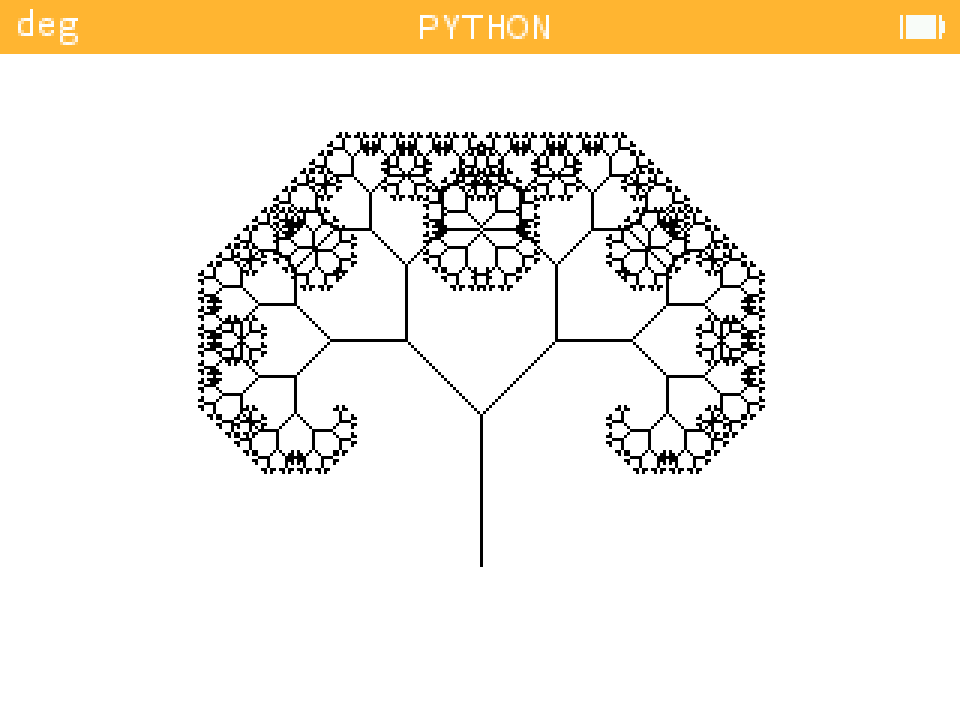
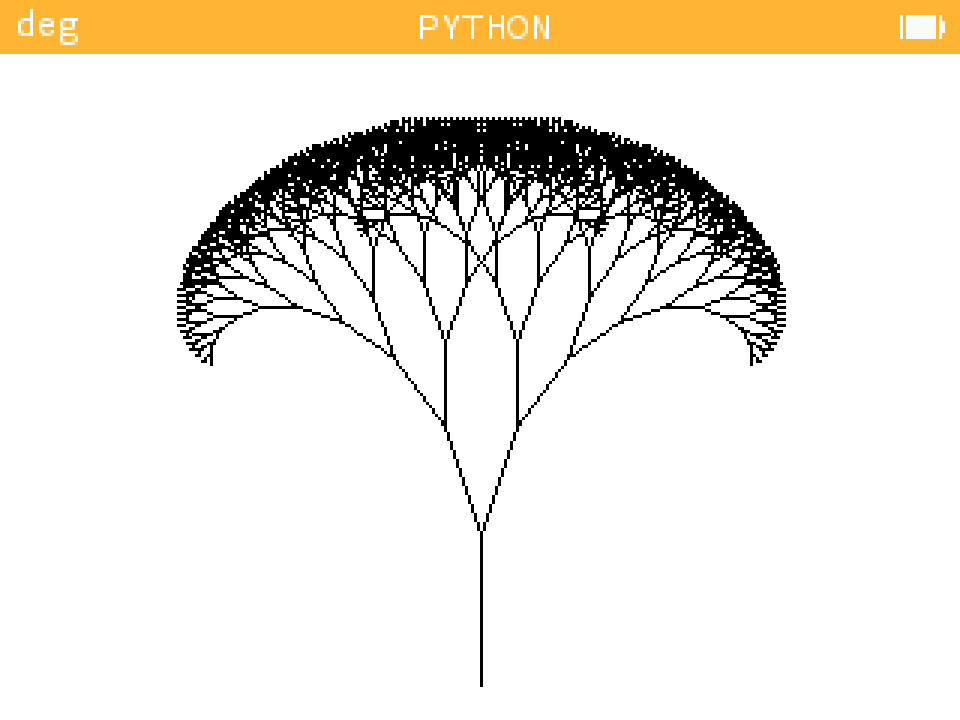
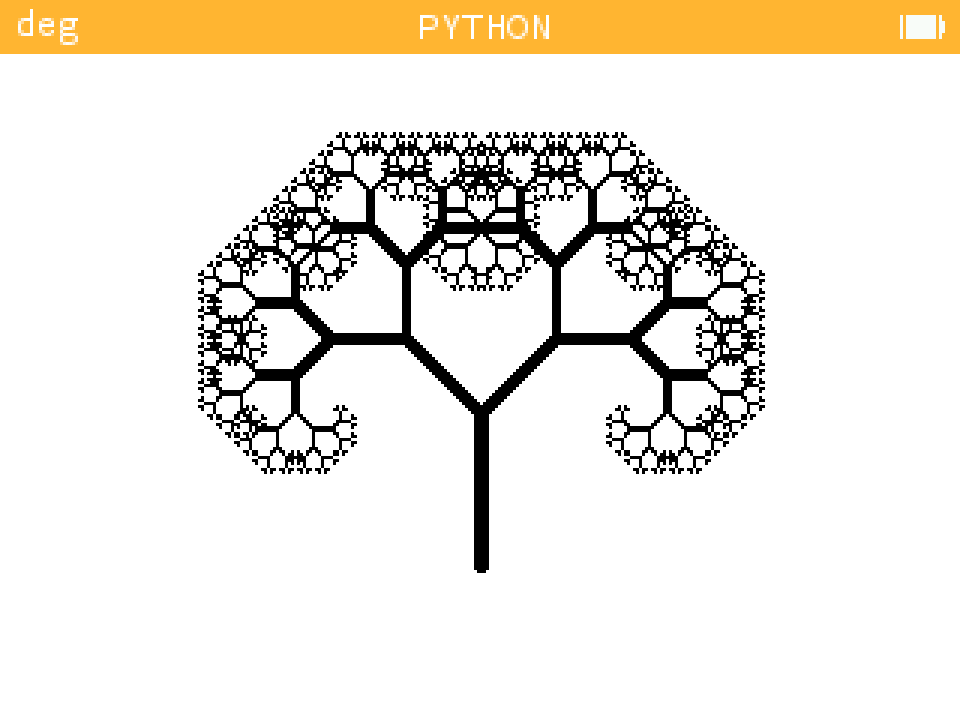
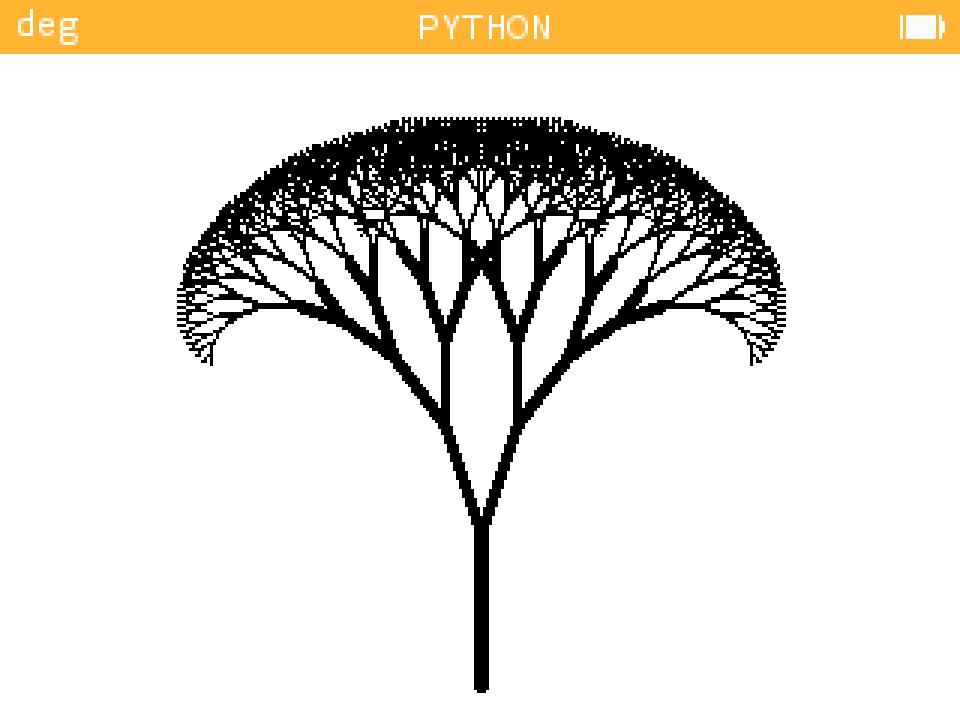
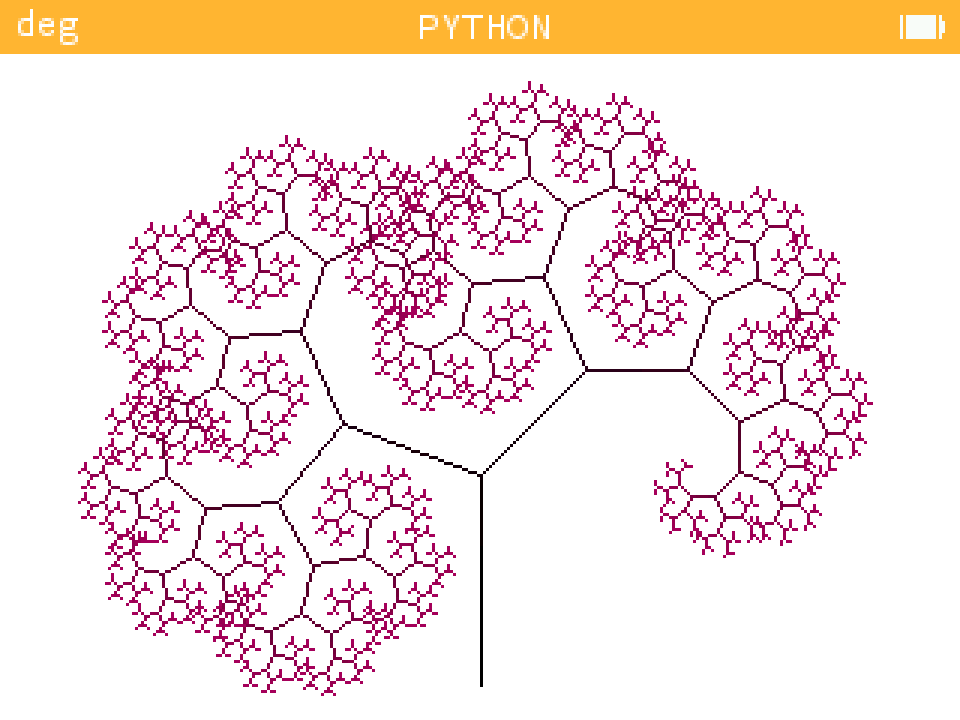
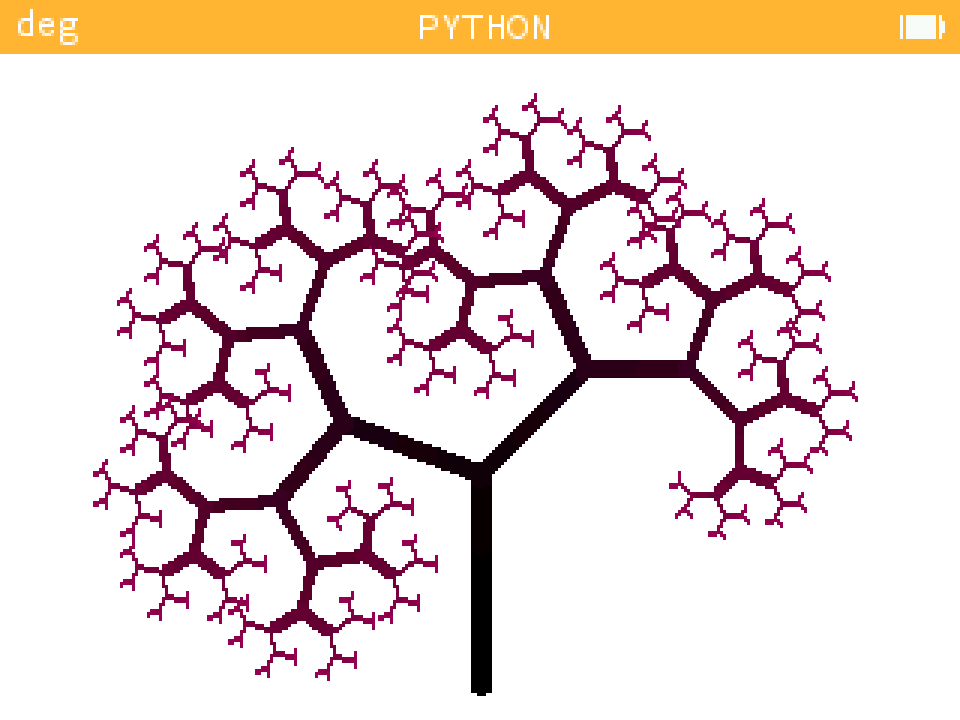
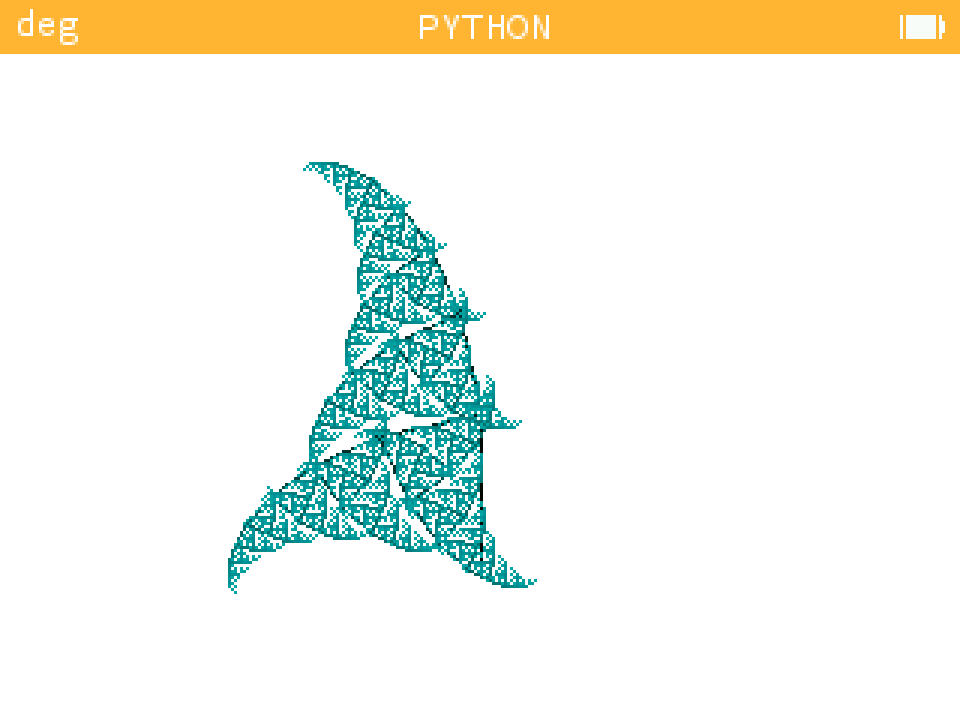
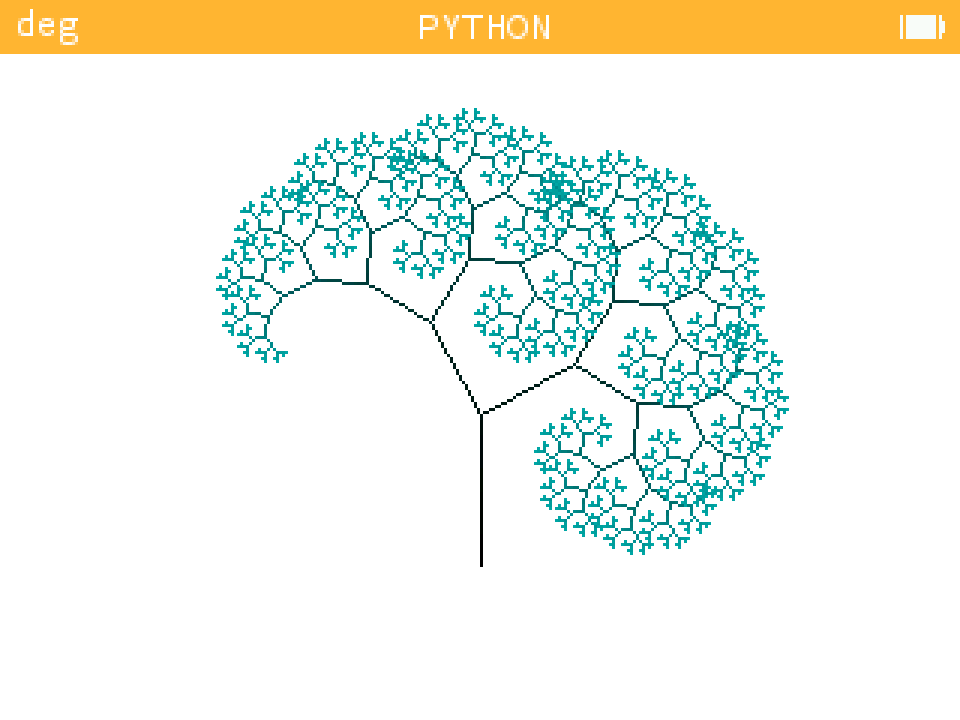
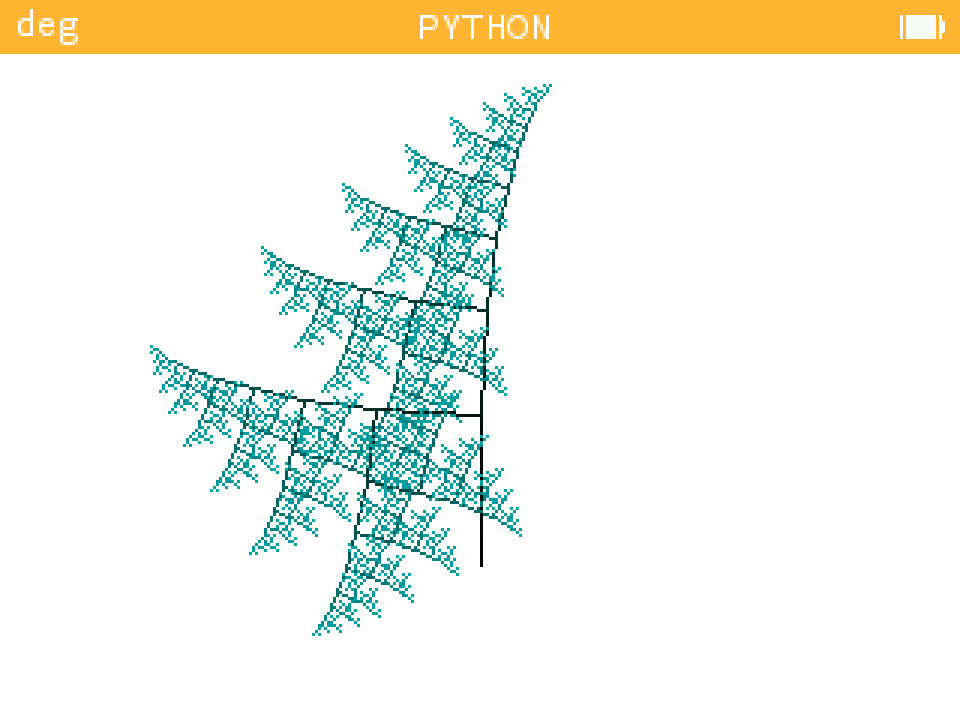
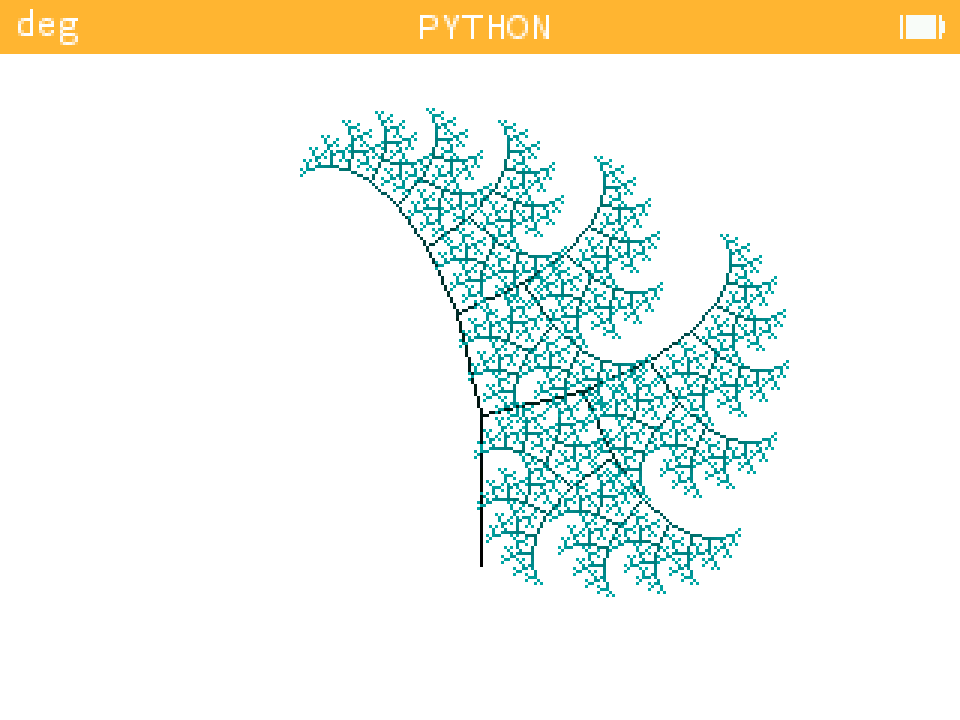
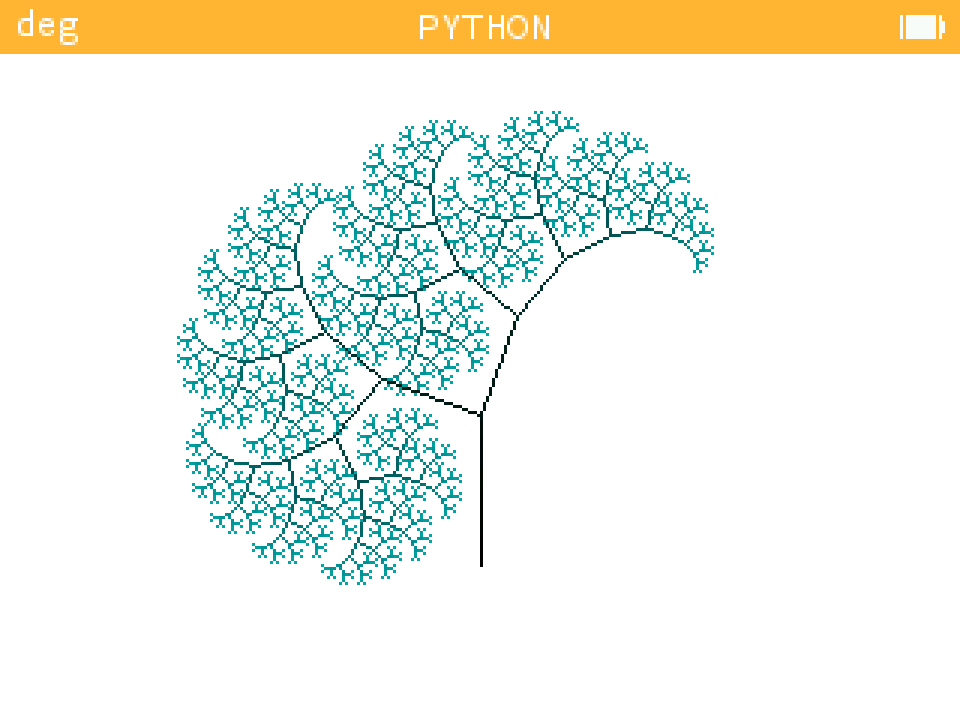
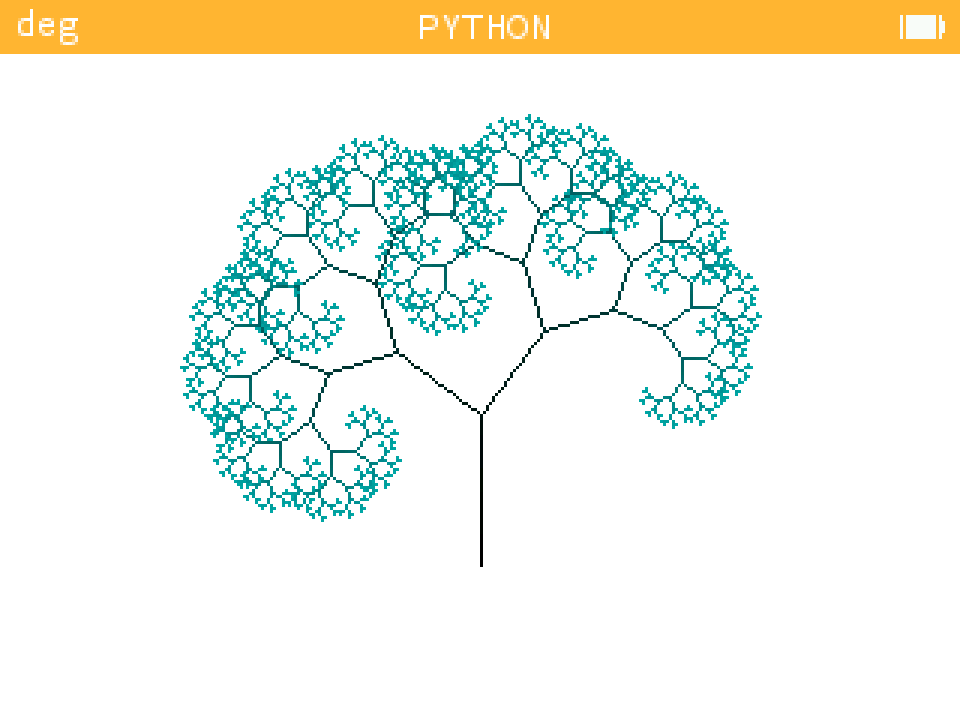
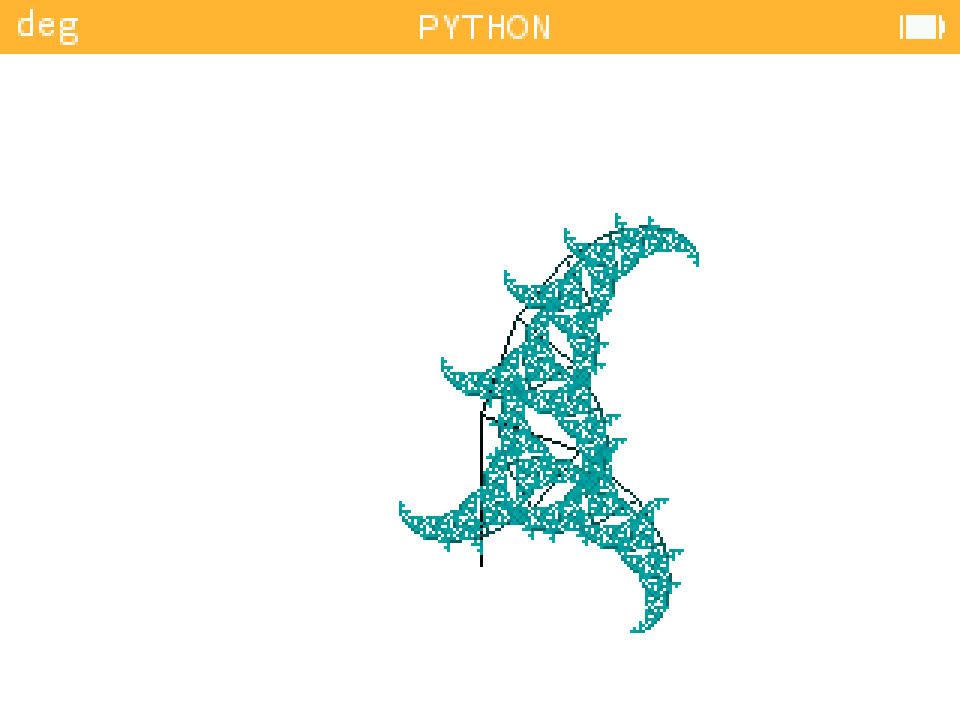
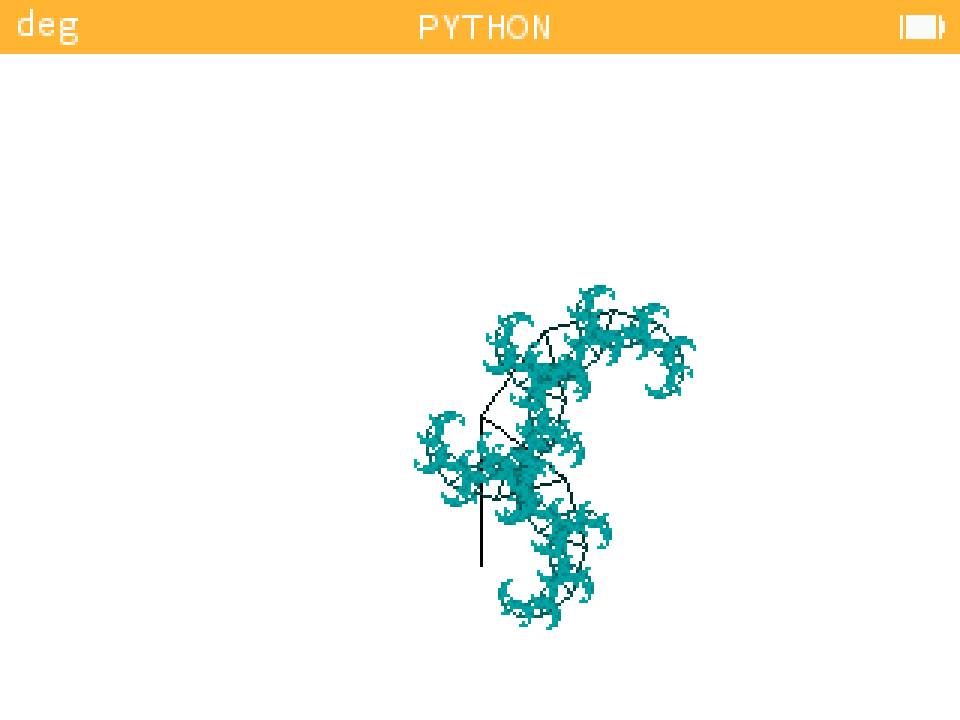
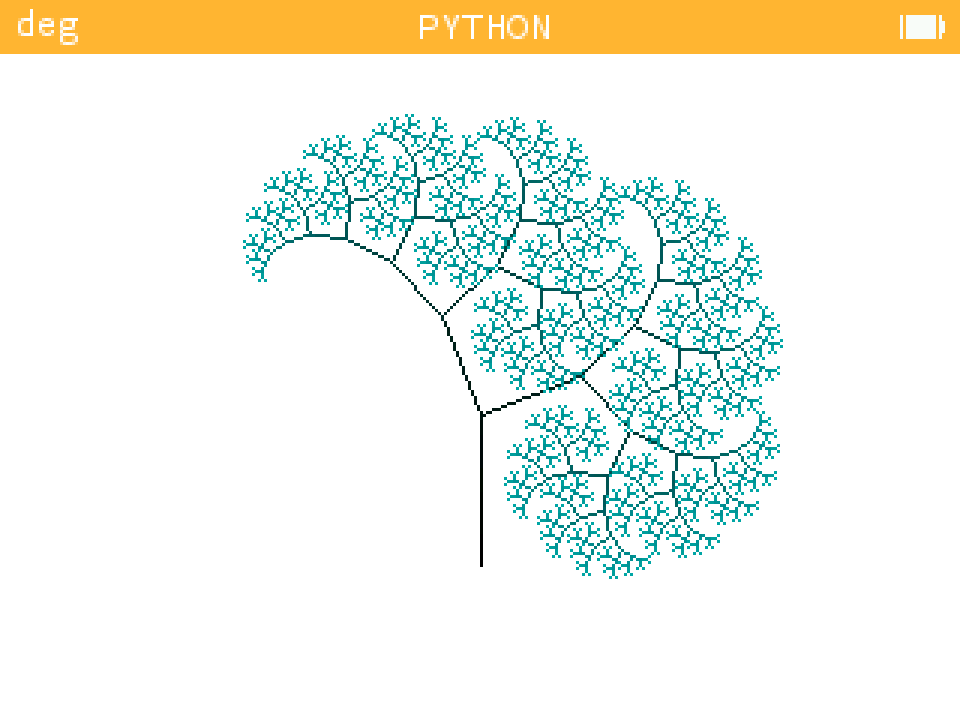
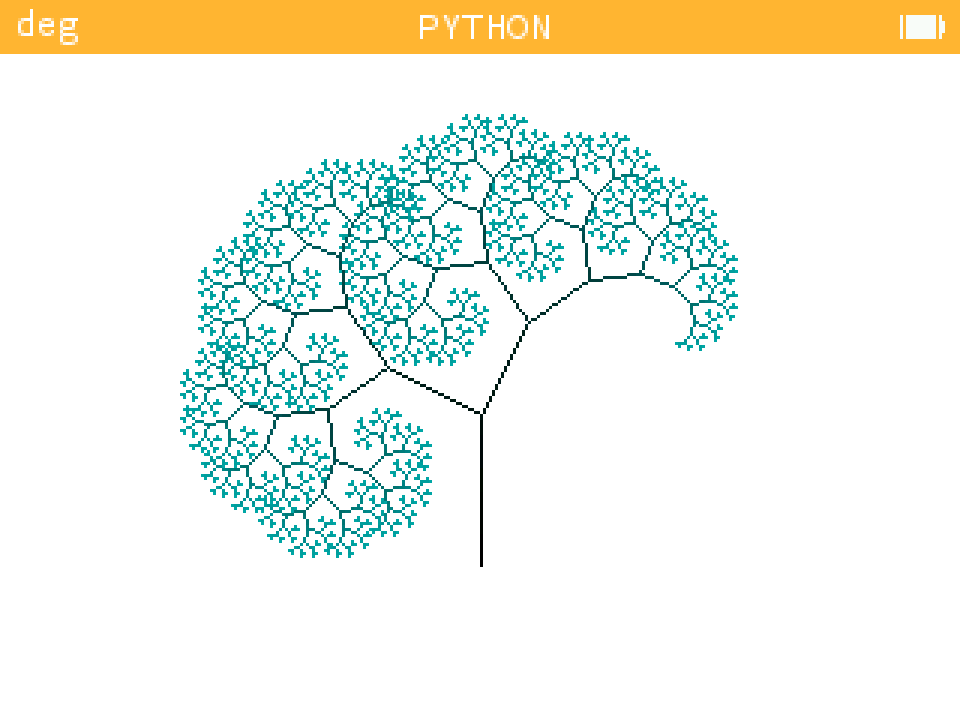
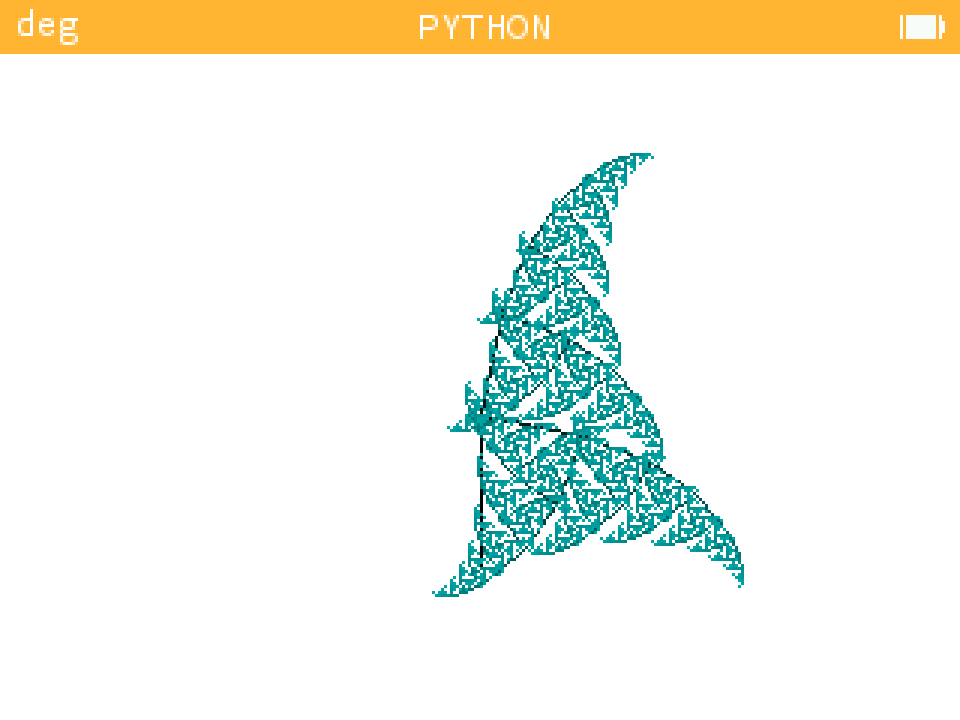
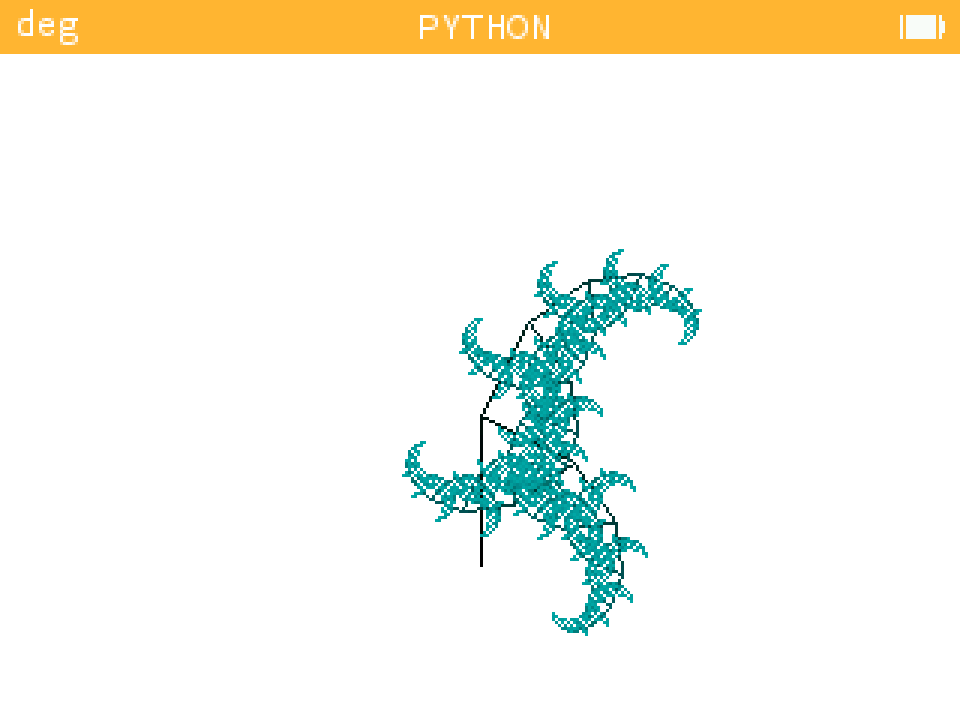
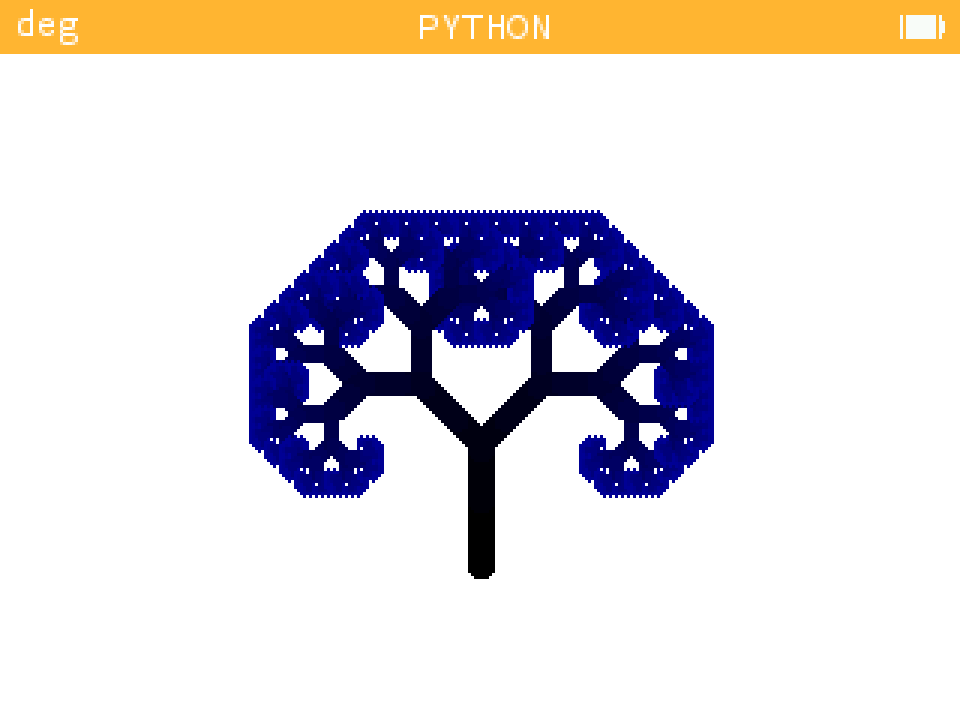
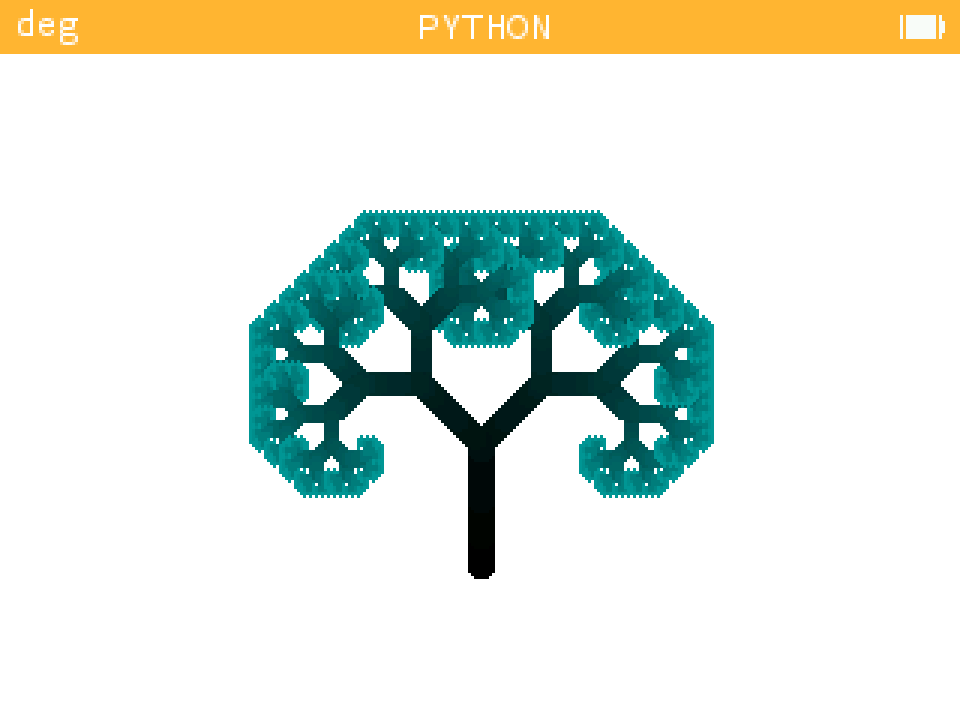
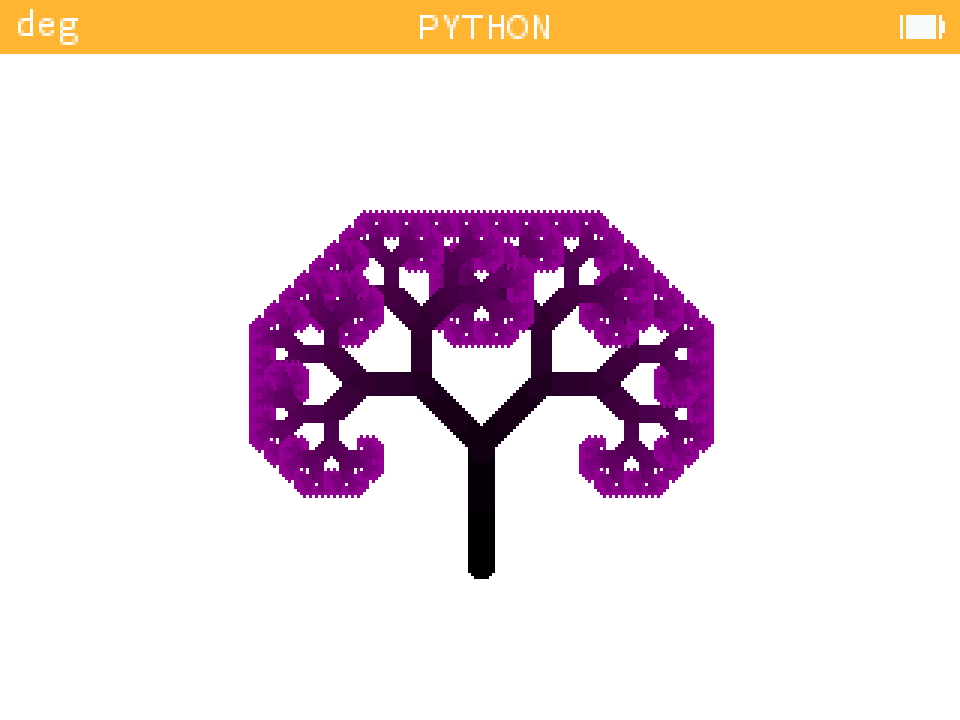
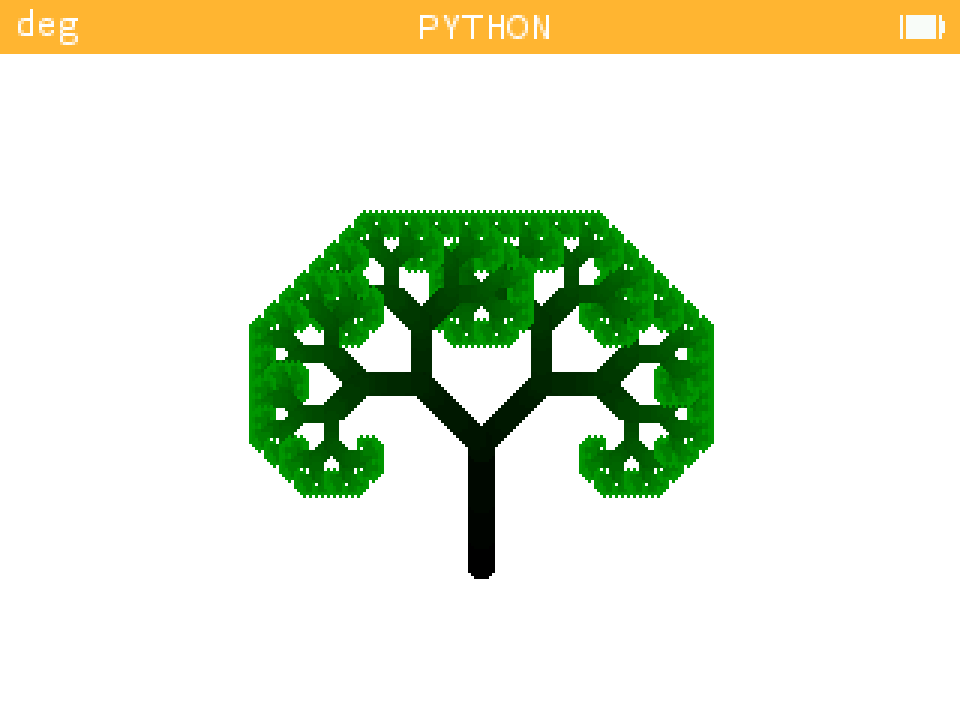
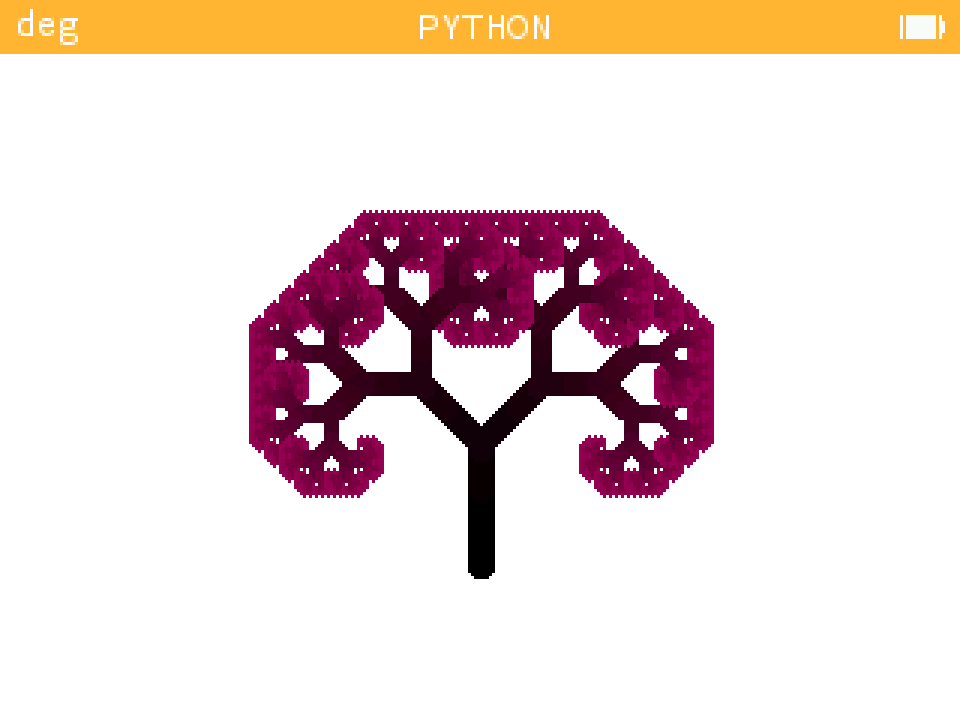
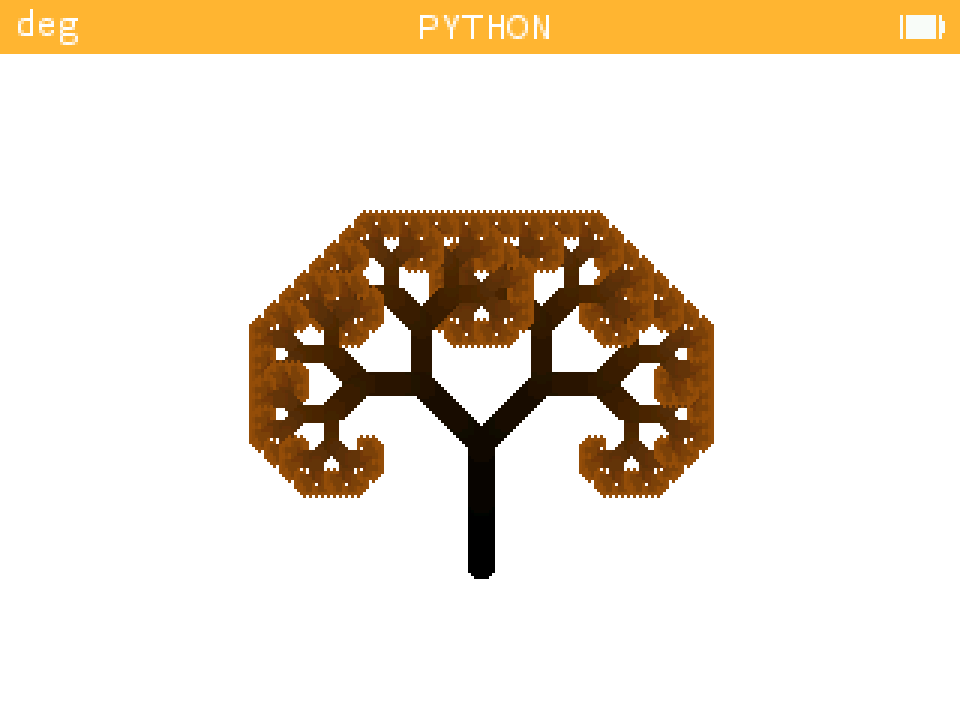
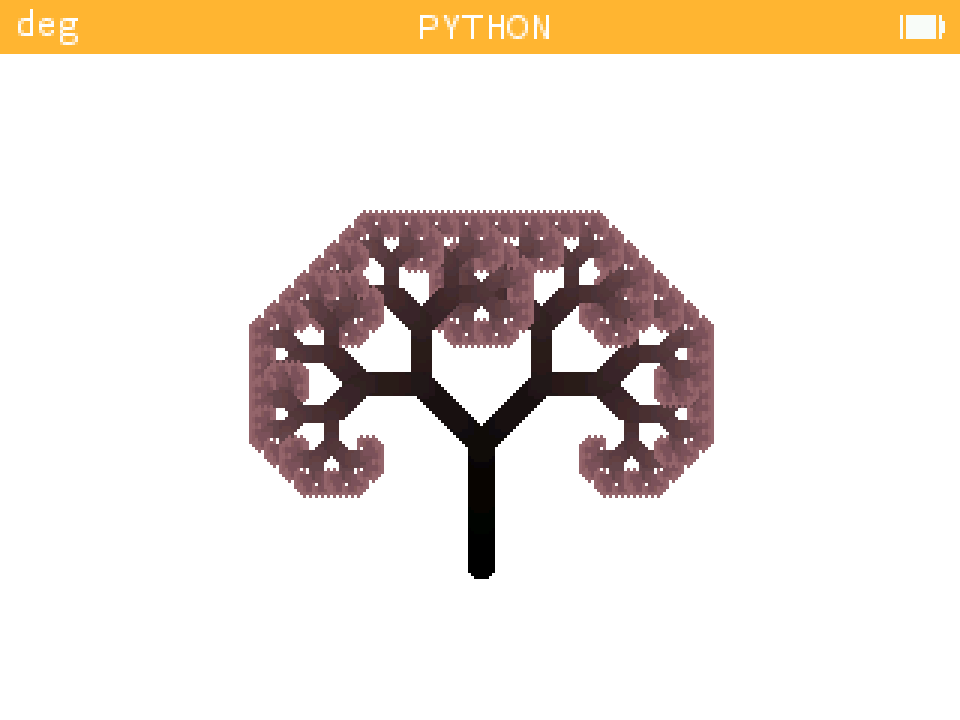
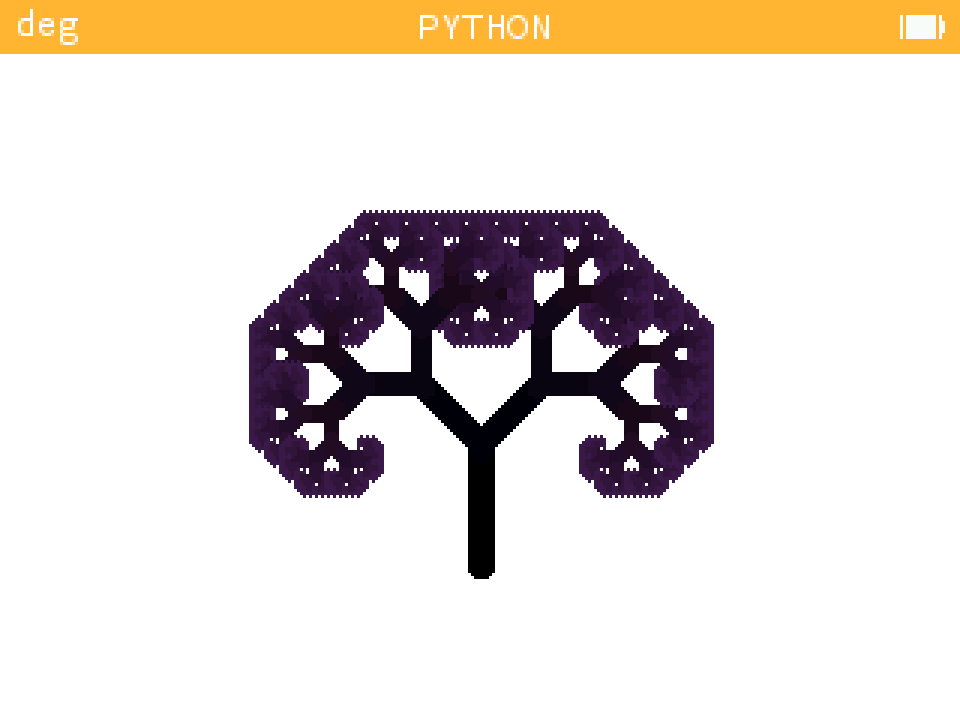
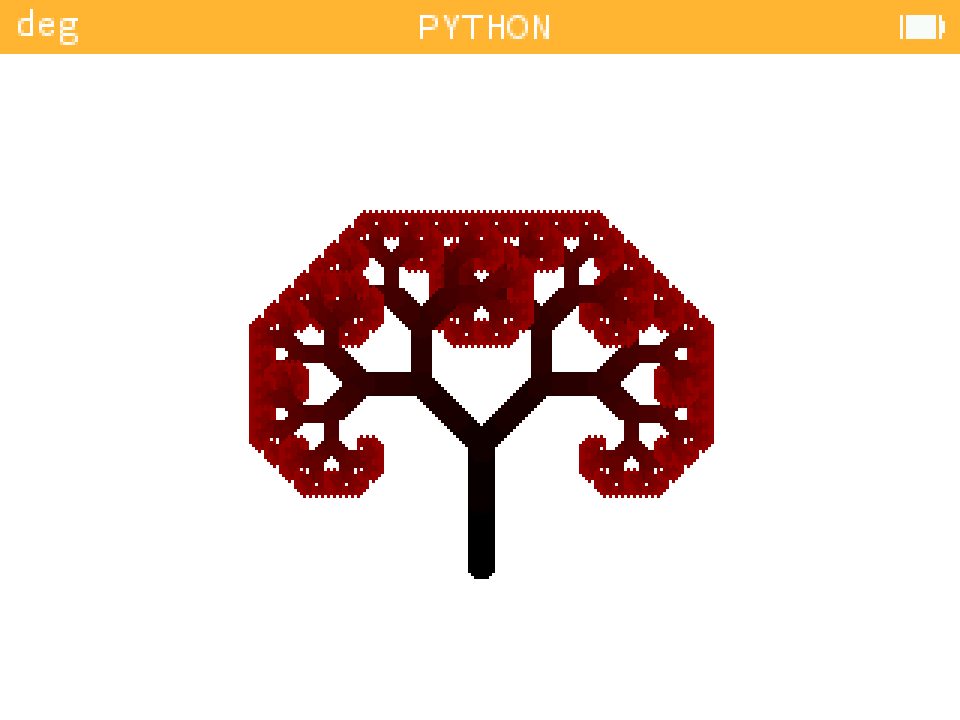
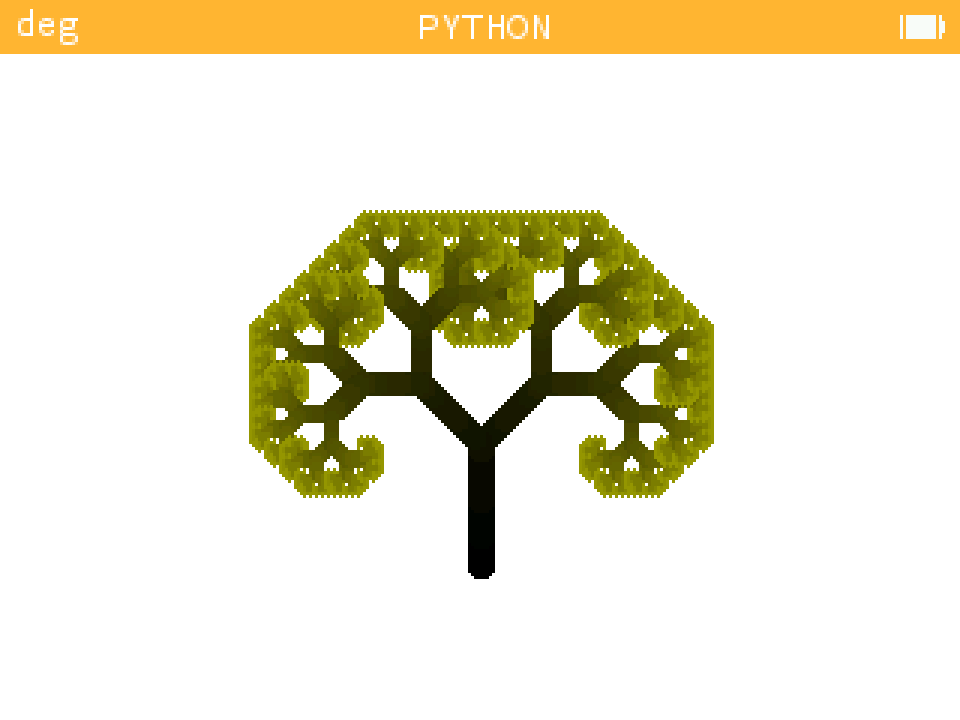
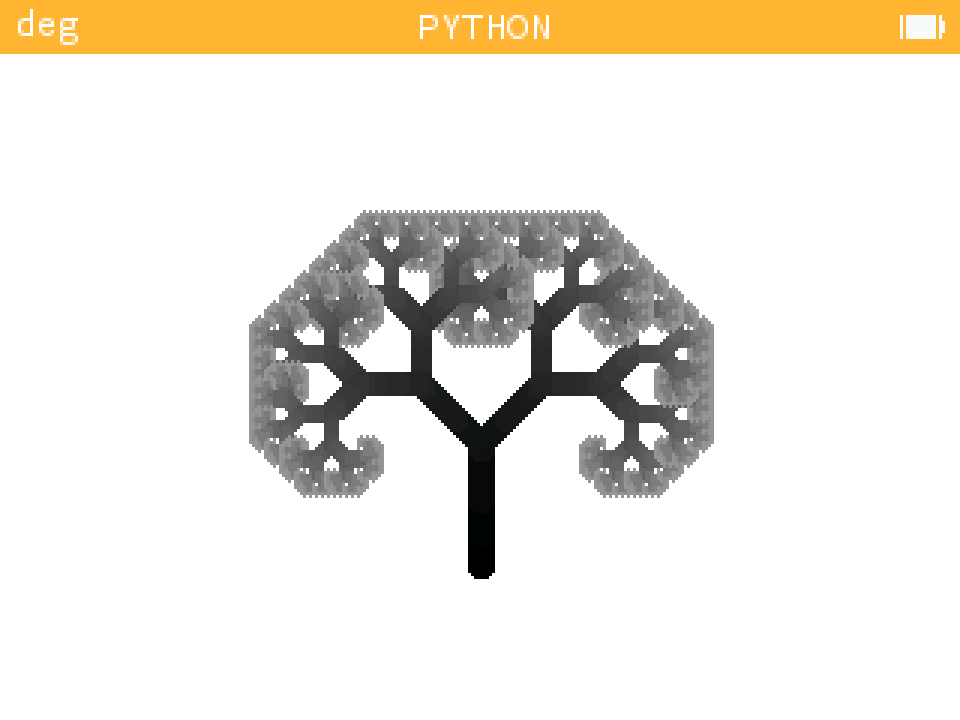
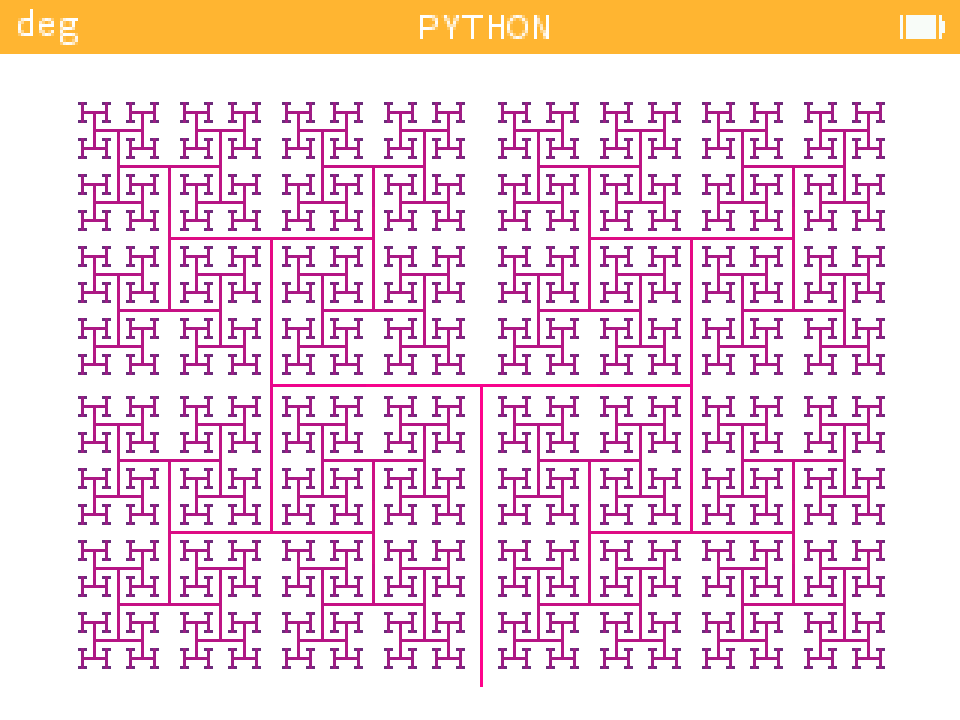
The link to the example script: example_fractal.py
And the source script: fractal.py

Don't forget to install the lines extension here in your computer !
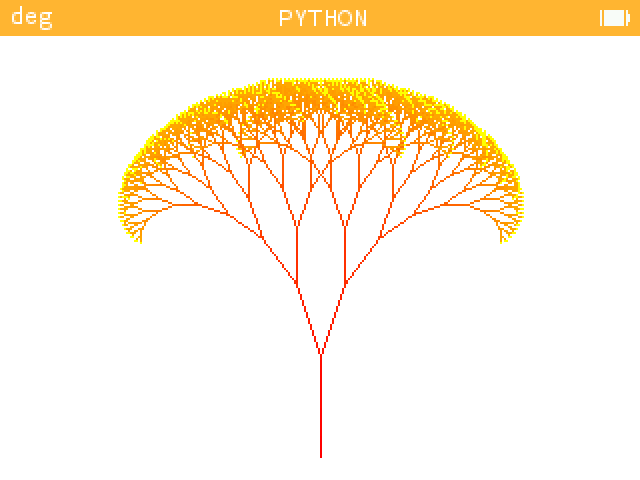
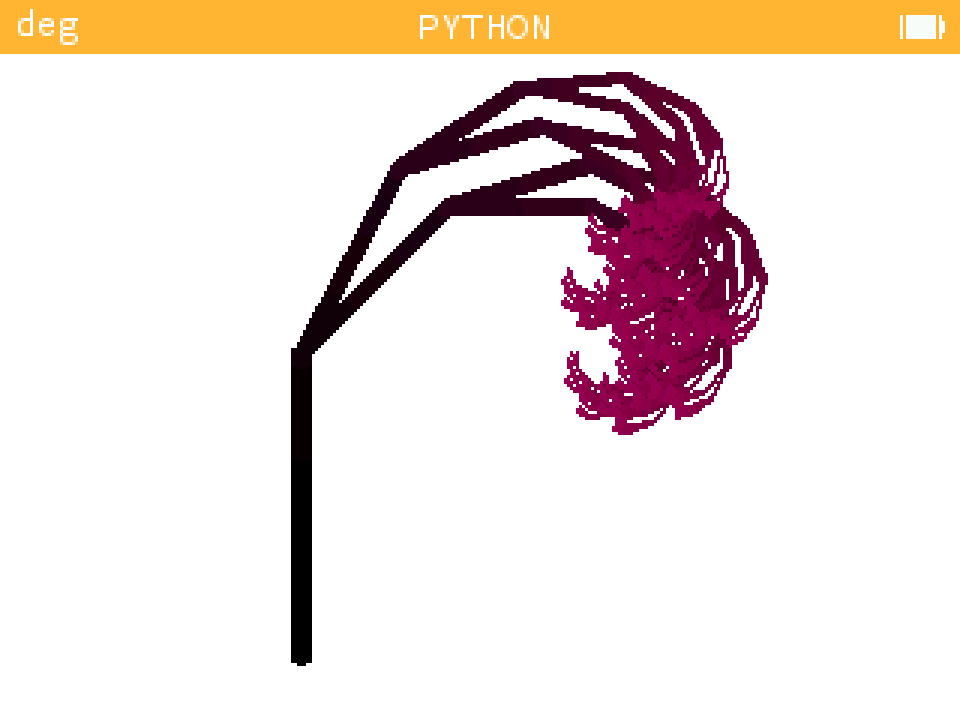
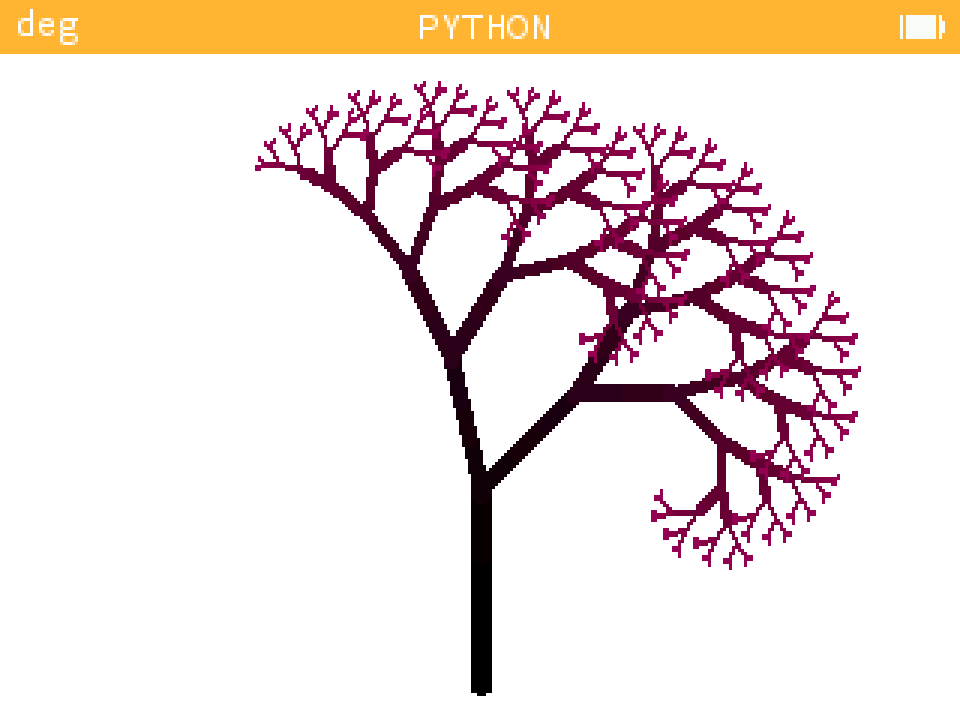
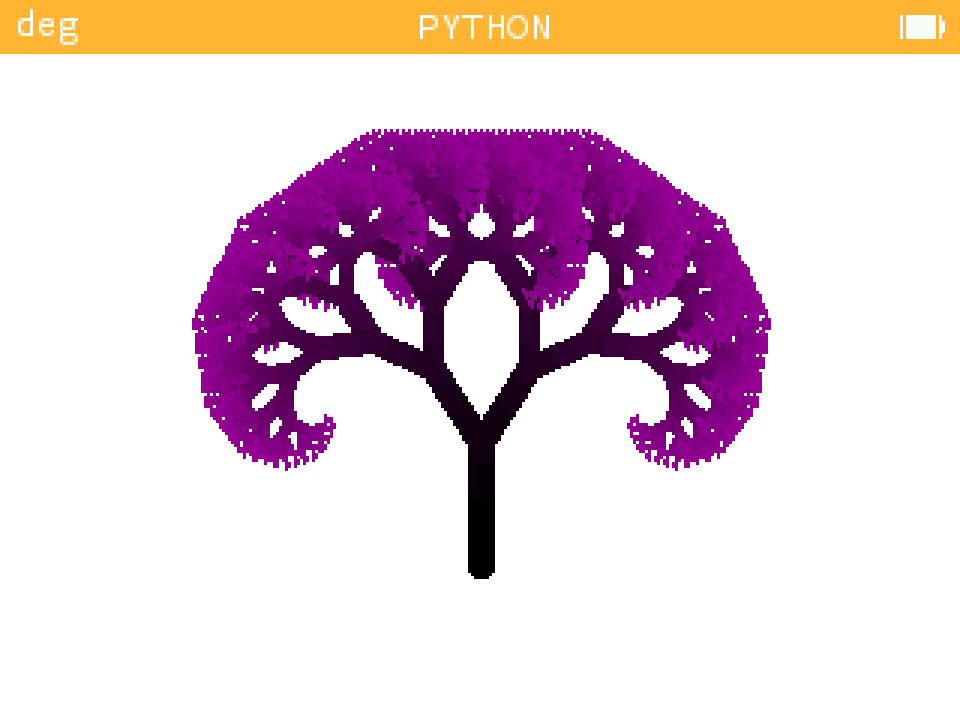
| Basic Tree | Palm Tree |
|---|---|
 |
 |
 |
 |
 |
 |
 |
 |
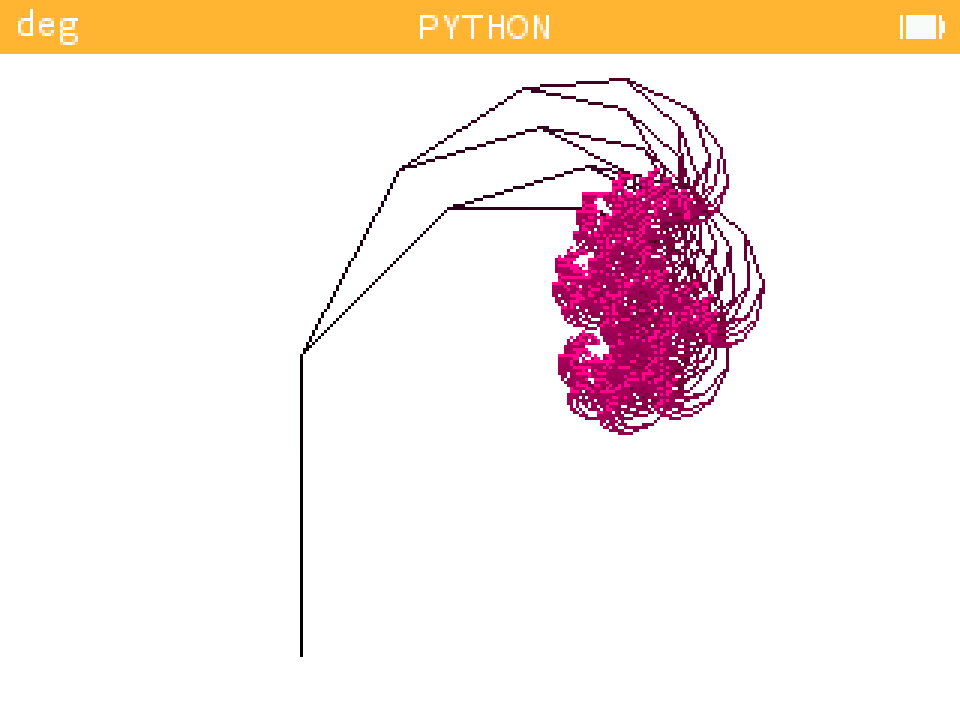
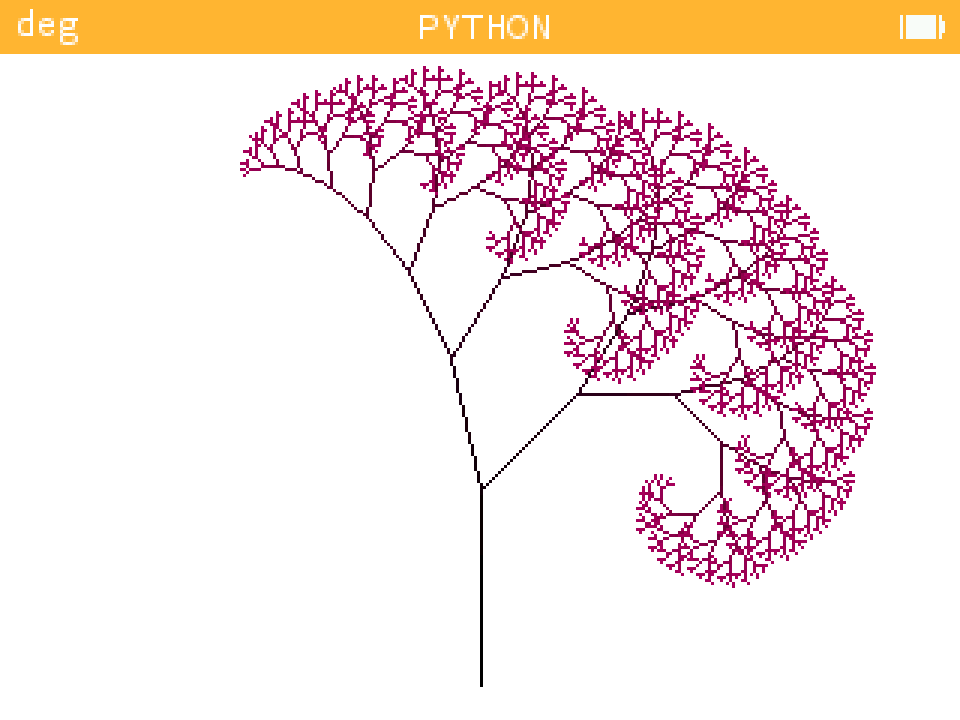
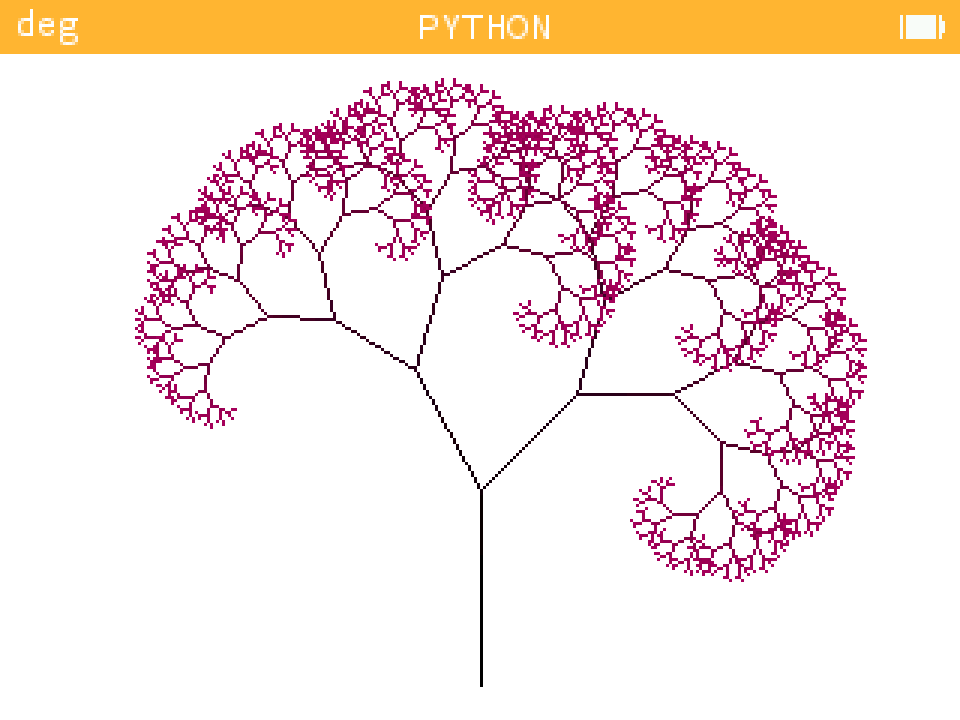
Magenta Trees
 |
 |
 |
 |
 |
 |
 |
 |
Cyan Trees
 |
 |
 |
 |
 |
 |
 |
 |
 |
 |
 |
 |
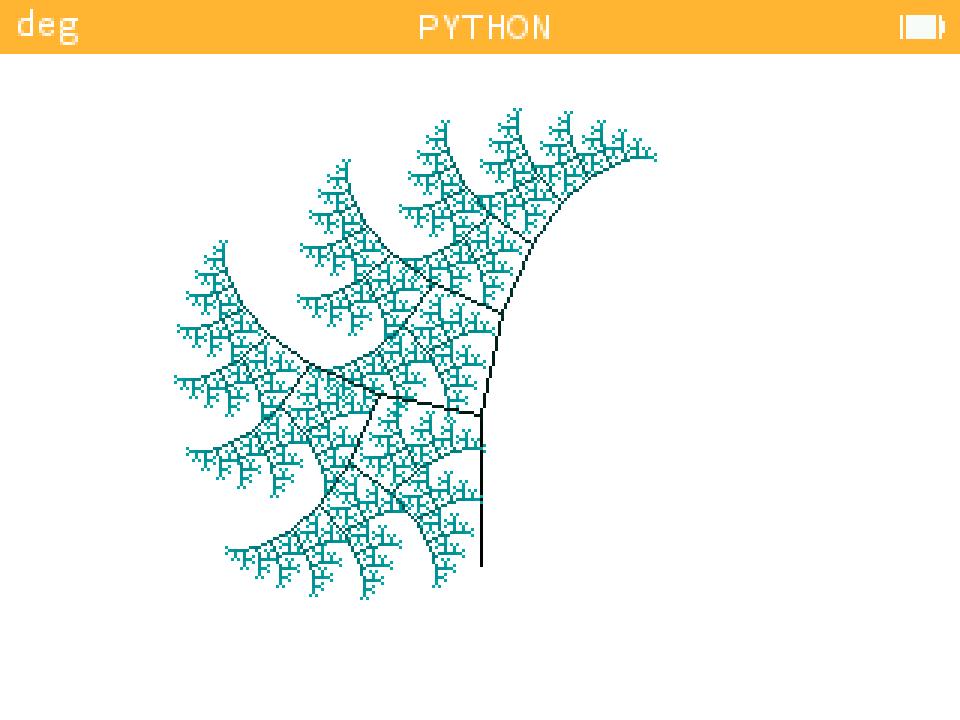 |
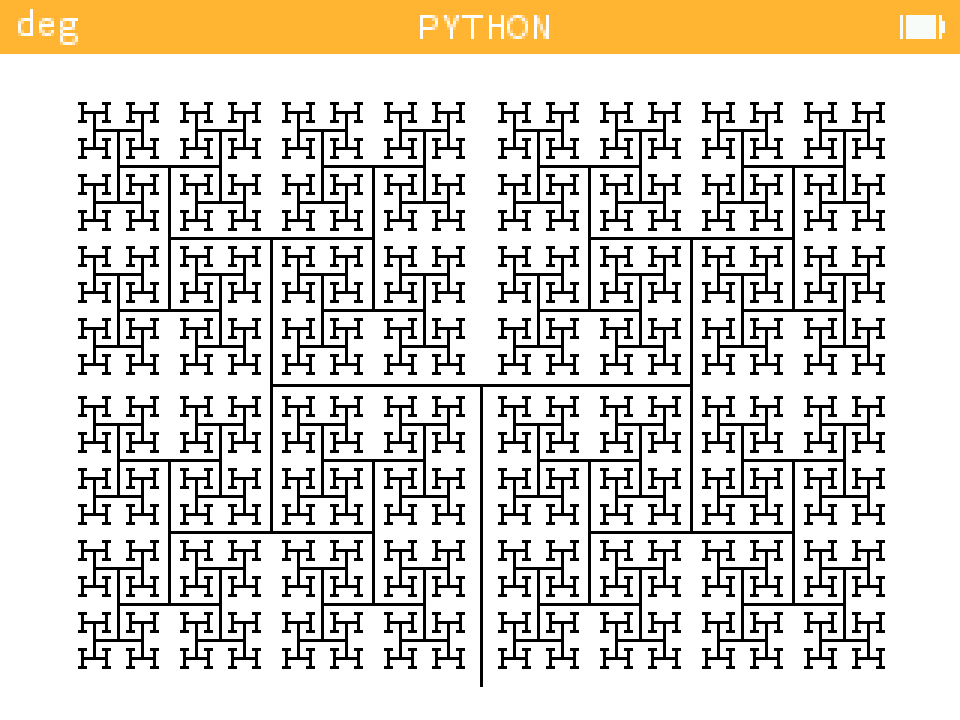
Examples of Trees
 |
 |
 |
 |
 |
 |
 |
 |
 |
 |
 |
 |
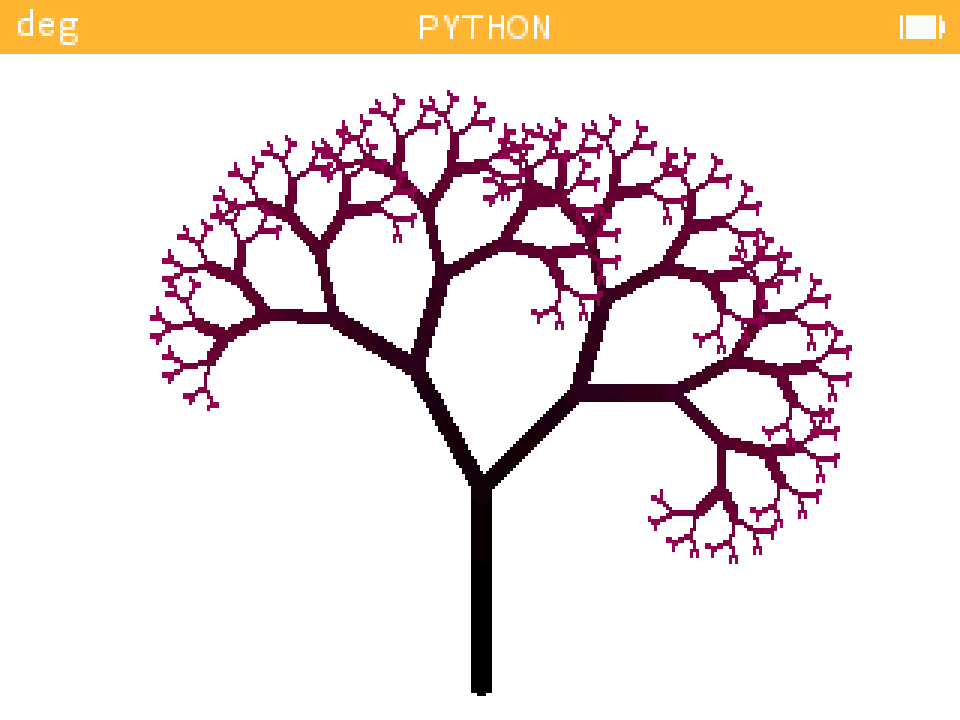
Angle Tree
 |
 |
Here are some extensions designed to work with the calculator. However, the latest extension, Grapher, will only work on a computer. They include a number of extra features, notably a reproduction of the turtle module, and another, much simpler one, of the matplotlib.pyplot module. I'll let you discover them with some beautiful images!
You need to copy and paste the code from the extension files into a new file created on the Numworks website.
- Extension Lines : lines_example.py
| Example |
|---|
 |
- Extension Ellipses : example_ellipse.py
| Example 1 | Example 2 |
|---|---|
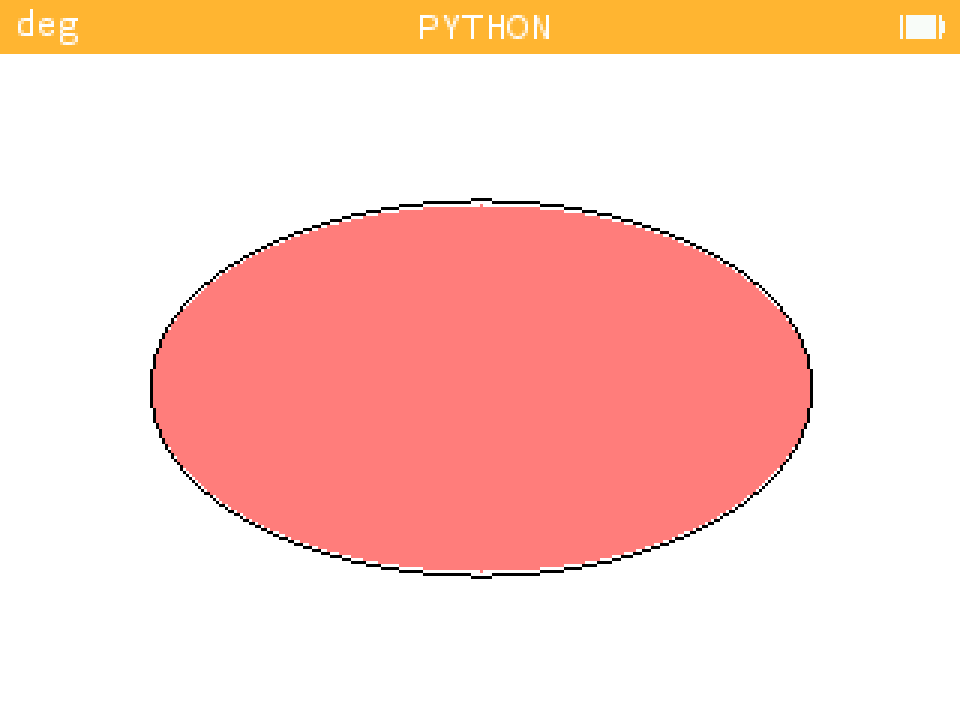 |
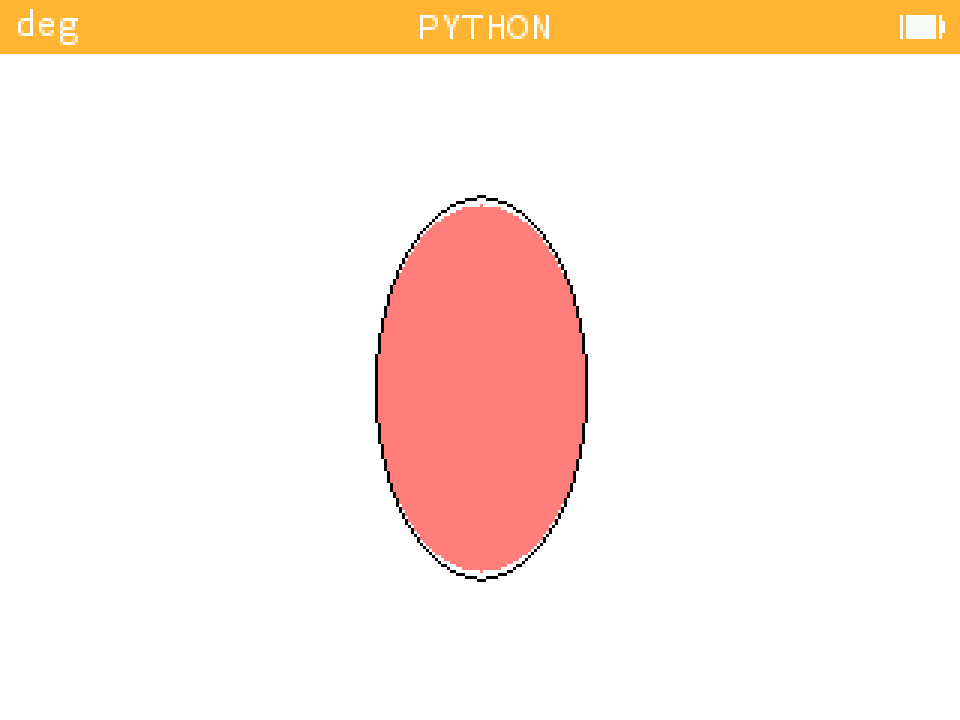 |
- Extension Turtle : turtle_example.py
The turtle extension has both a compact and a non-compact file for use on the computer.
| Example 1 | Example 2 |
|---|---|
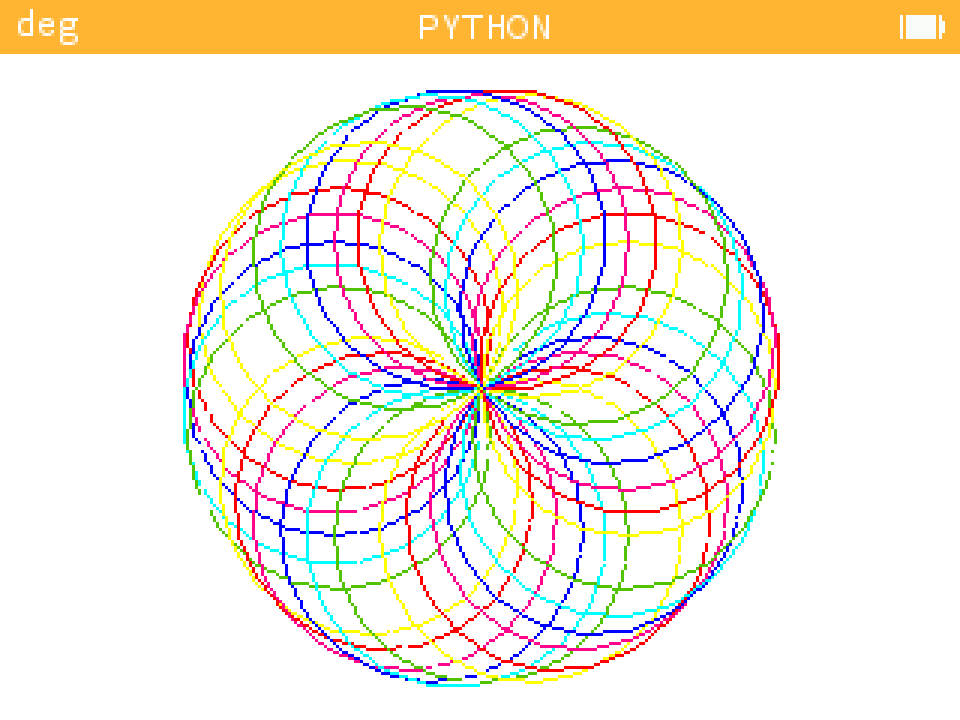 |
 |
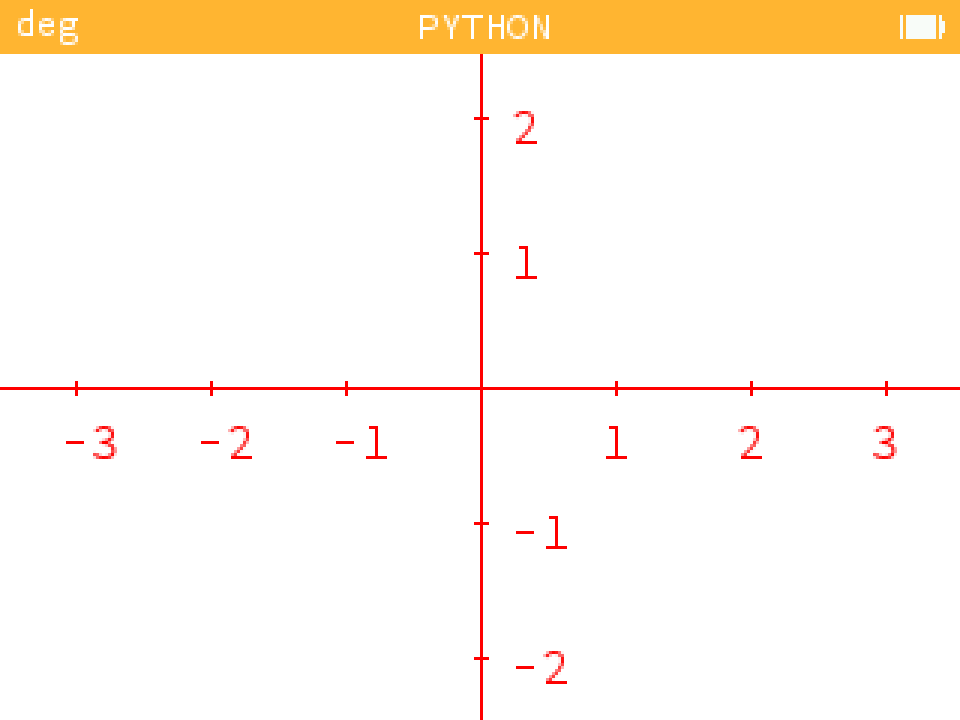
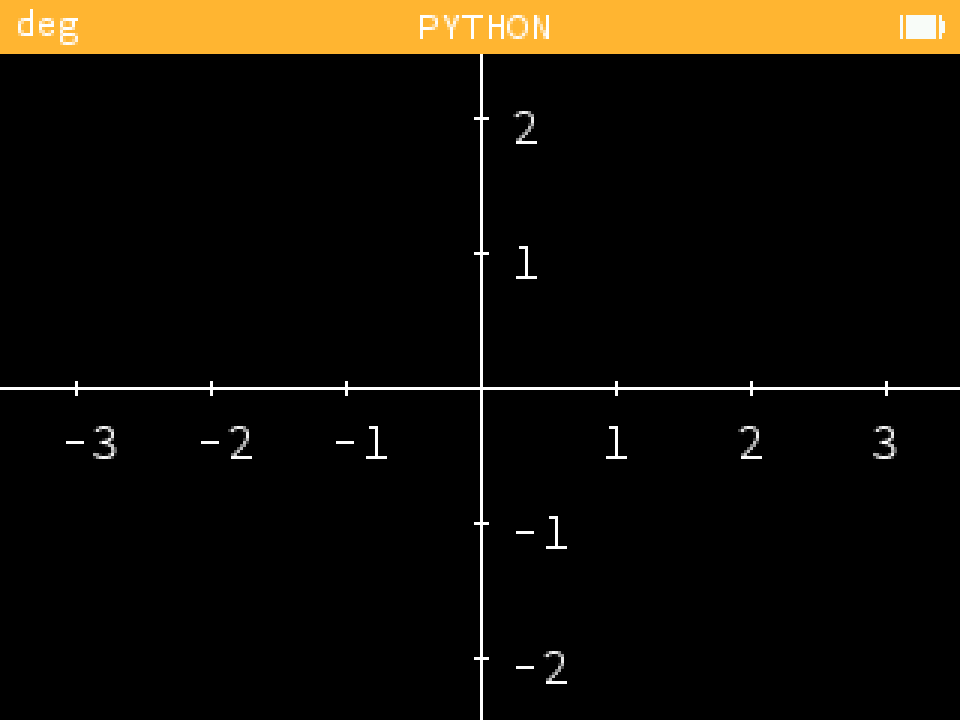
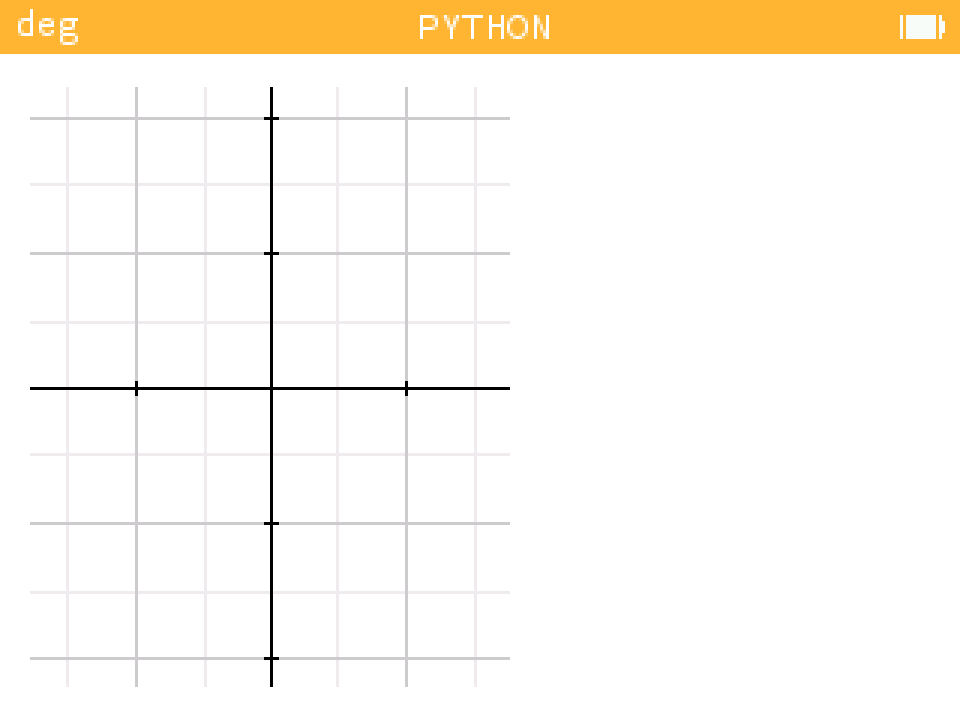
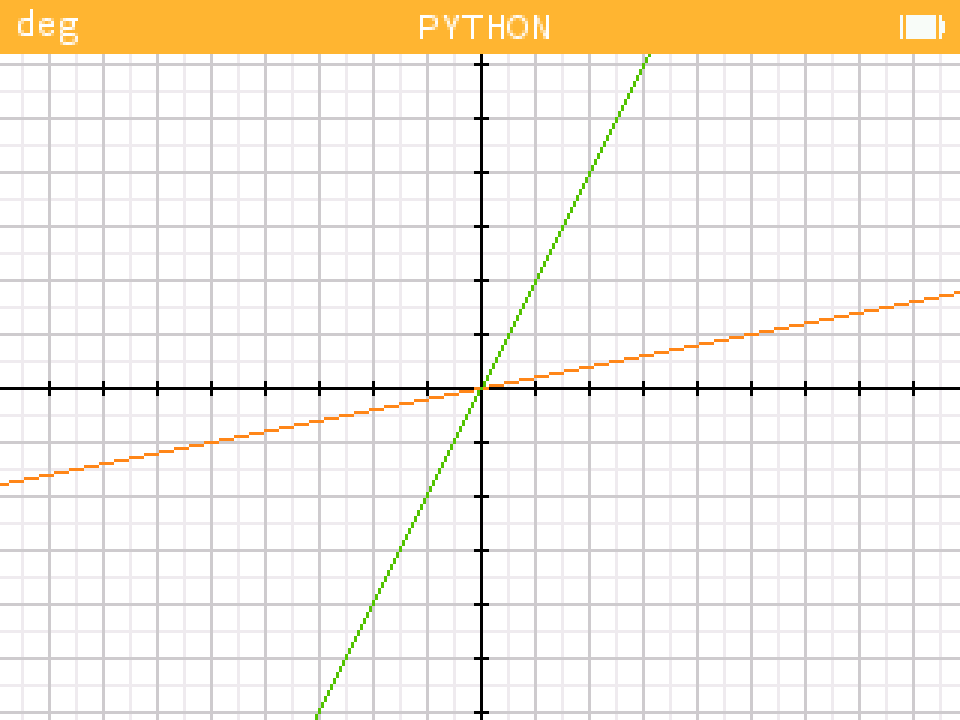
- Extension Grapher : grapher_example.ipynb
| Keys | Short |
|---|---|
| Arrows [Up, Down, Right, Left] | allows you to move around the grapher |
| 'Maj'+'=' or '+' | zoom in or out |
| 'Maj'+'à' or '0' | refocuses the graphic |
| 'Ctr'+'o' | changes the emulator, thus increasing speed |
Examples
 |
 |
 |
 |
 |
 |
 |
 |
 |
 |
 |
 |
Here are two QR codes to easily find the Visual library on GitHub and on the official Numworks website. Use them without restriction!
| GitHub | Numworks |
|---|---|
 |
 |
A list of frequently asked questions (for the moment there is none).