![]()
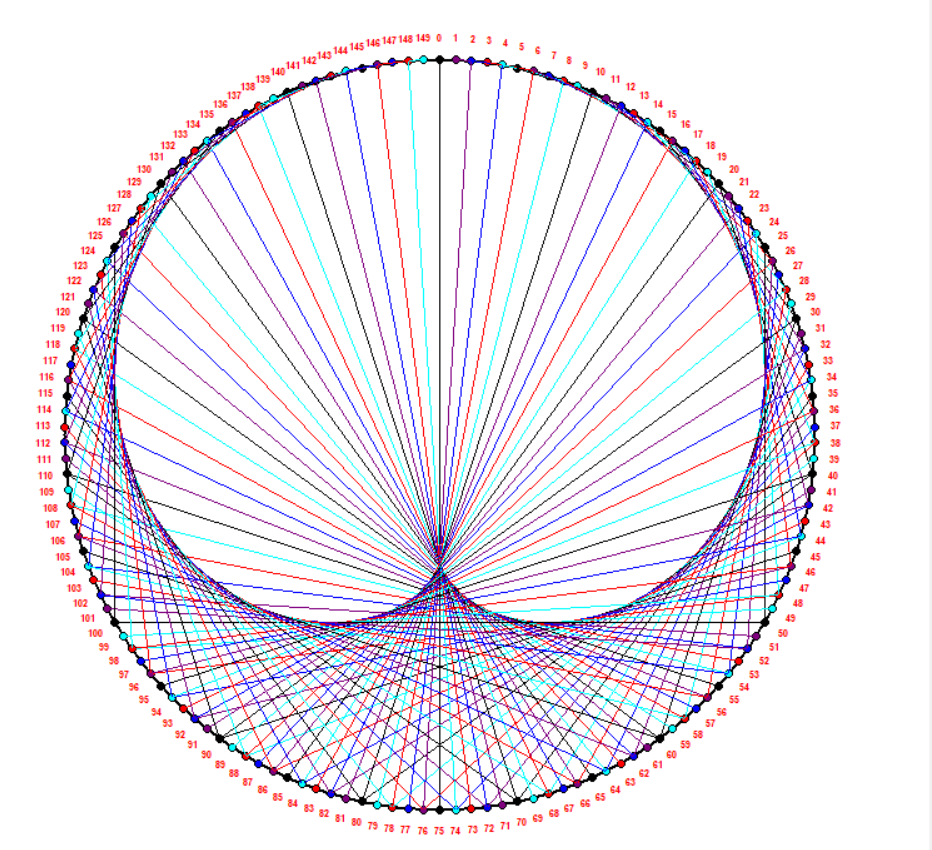
In this project, we will highlight the symmetries that are hidden in the distribution of numbers in the multiplication table of positive reals, when viewed through modulo k arithmetic as we change k, in a way that is less often explored: Modular Arithmetic. Based on our construction process, the graphic presentation contains only straight lines. In other words, it is a kind of optical illusion that we are witnessing and it is the entanglement of all these straight lines that gives us the impression of this curved figure that appears.
The only image that can possibly be remembered for modular arithmetic is the trigonometry one. But it is the same mechanics as for a simple clock: every time the needle performs a circle turn, we return to the same number. Mathematically speaking, the clock is said to have a modular system of 12: the number 13 returns to the number 1. This type of system allows us to represent multiplication tables. By placing a certain number of points on a circle and connecting the points following a multiplication.
You can clone the repository on your local machine and reach it with the following commands :
$ git clone https://github.com/goujilinouhaila-coder/Multiplication_table.git$ cd Multiplication_table
You will find in the attached video, the representation of the group project here.
To install this package, you can run its command prompt the following line.
$ pip install multiplication_table And also, you can discover it in the link below:
https://pypi.org/project/multiplication-table/
The package documentation is available here.
The structure of our project is as follows:
The beamer presentation is kept in the ./beamer folder. A documentation will be made using the sphinx package is kept in the ./doc directory..
/.multiplication_table/Test contains all the tests implemented on the package functions.
In addition, we used a continuous integration action diposed in ./github/workflows folder.
All the main code is available in the /.multiplication_table folder. And the ./report folder contains a jupyter notebook, that generates the graph on the console and the graphical interface.
Finally, to try if our package works well we tested it on some examples that are stored in the folder /.Example
- Goujili Nouhaila, nouhaila.goujili@etu.umontpellier.fr
- Berrandou Assia, assia.berrandou@etu.umontpellier.fr
- Sobolak Valerian, valerian.sobolak@etu.umontpellier.fr
- Sene Assane, assane.sene@etu.umontpellier.fr