This project is divided into two sections : data engineering and data analysis of an employee database.
- Python Libraries:
- config
- matplotlib.pyplot
- pandas
- SQLAlchemy
- Jupyter Notebook
- PostgreSQL
- Quick database diagram tool at http://www.quickdatabasediagrams.com
The purpose of this section of the project is to draw the entity-relationship diagram (ERD) showing the relationships between the tables in the employee database, and to load the employee data from the csv files to PostgreSQL. The employee data is initially given on six csv files, which were used in sketching the ERD of the six tables from the six csv files using http://www.quickdatabasediagrams.com. The final ERD is named EmployeeDB_ERD.png.
To try this section of the project, ensure that all csv files and the SQL queries are saved in the same folder on your computer.
- ERD diagram 'EmployeeDB_ERD.png' can be created using http://www.quickdatabasediagrams.com.
- Create the employee database in postgreSQL.
- Run the EmployeeDB_Tables.sql file in postgreSQL to create all the tables and their relationships.
- Load each csv file into their corresponding table in postgreSQL.
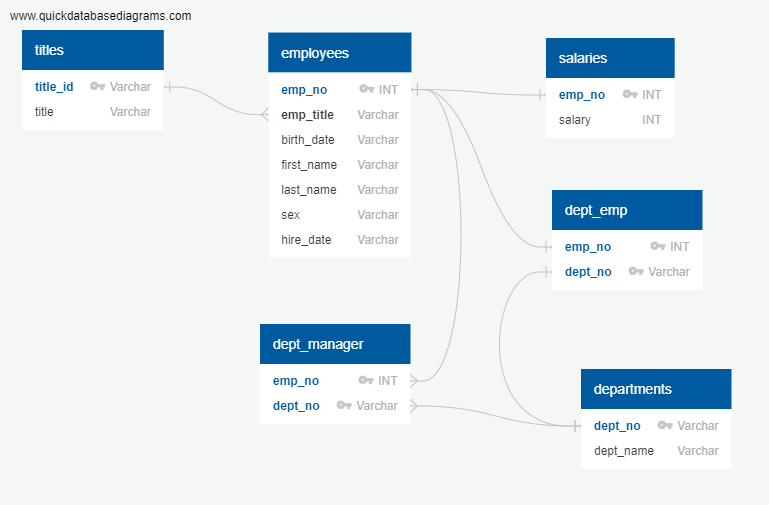
From http://www.quickdatabasediagrams.com, the table schema for each of the six CSV files is created, specifying the data types, primary keys, foreign keys, and other constraints. The queries used in creating the six tables are saved in EmployeeDB_Tables.sql file. Then, the CSV files are loaded into the corresponding SQL tables in postgreSQL.
- EmployeeDB_ERD.png contains the ERD of the database.
- EmployeeDB_Tables.sql contains SQL queries to create all the tables and the relationships between them.
- Resources folder contains all the six csv files used to populate the tables in the database.
The purpose of this section of the project is to analyse the employee data stored in the postgreSQL in order to get some information, using SQL queries. The queries are stored in the EmployeeDB_Queries.sql file. The information required from the analyses are:
-
The following details of each employee: employee number, last name, first name, sex, and salary.
-
The first name, last name, and hire date for employees who were hired in 1986.
-
The manager of each department with the following information: department number, department name, the manager's employee number, last name, first name.
-
The department of each employee with the following information: employee number, last name, first name, and department name.
-
The first name, last name, and sex for employees whose first name is "Hercules" and last names begin with "B."
-
All employees in the Sales department, including their employee number, last name, first name, and department name.
-
All employees in the Sales and Development departments, including their employee number, last name, first name, and department name.
-
In descending order, the frequency count of employee last names, i.e., how many employees share each last name.
In addition to the analyses mentioned above, the employee database was imported to Pandas using SQLAlchemy. Then, the following charts were created
-
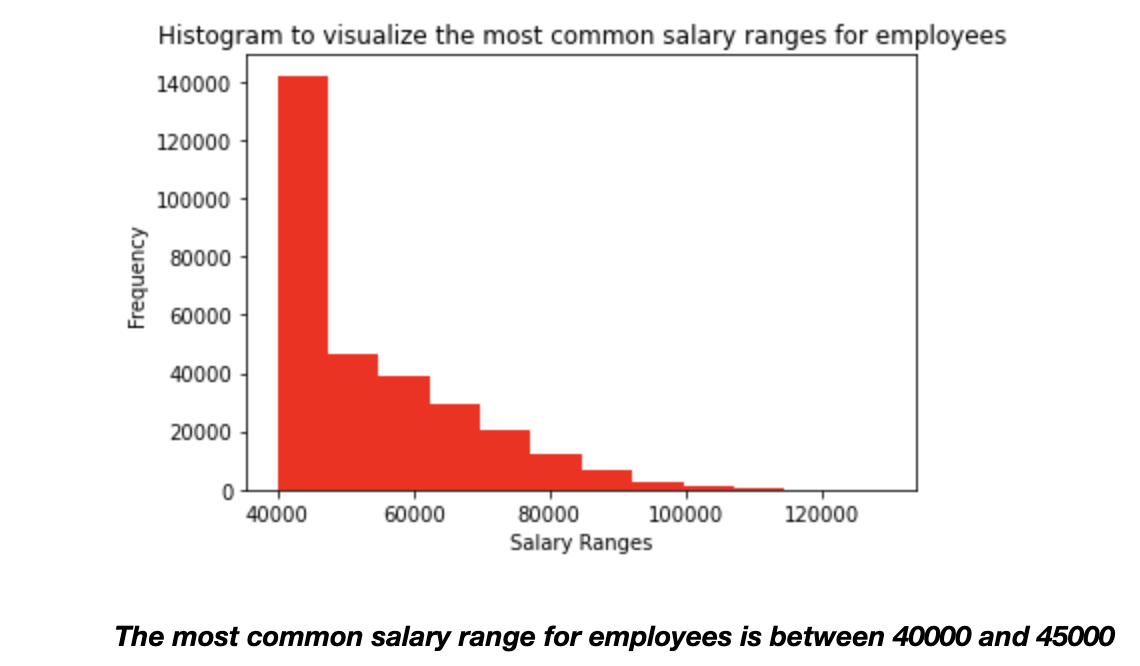
A histogram to visualize the most common salary ranges for employees.
-
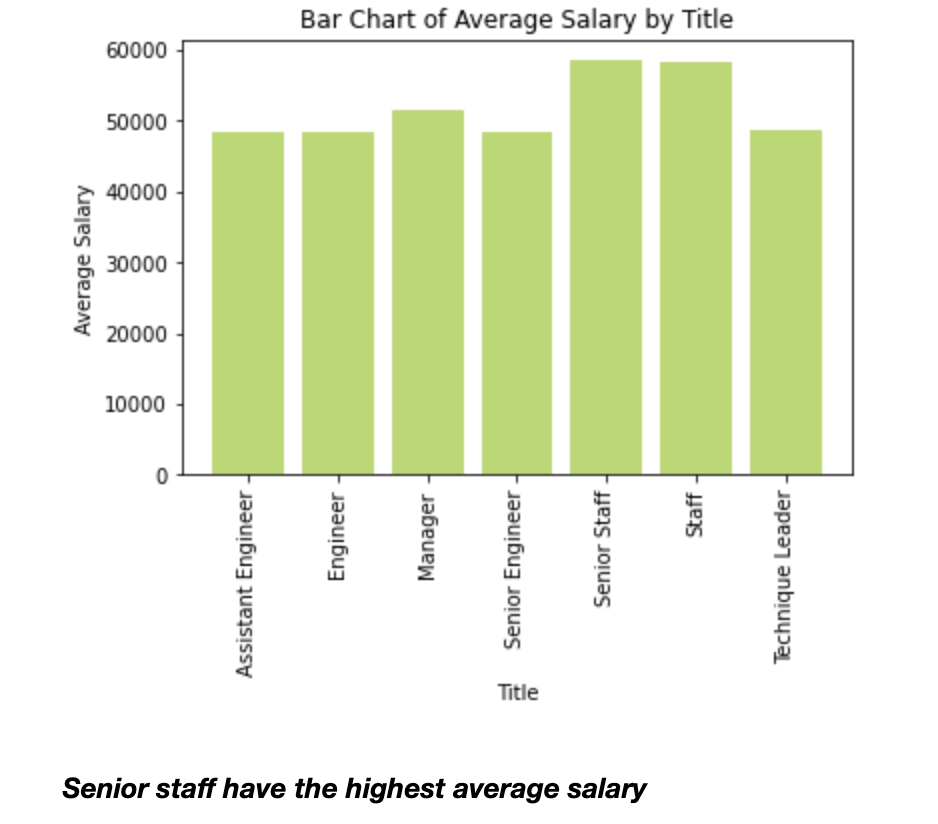
A bar chart of average salary by title.
- To see the output of the analyses above, run the SQL queries in EmployeeDb_Queries.sql file using the query tool in postgreSQL.
- To see the visualization, run the EmployeeSQL.ipynb file in Jupyter Notebook.
- EmployeeSQL.ipynb contains the python code to import the employee database from postgreSQL using SQLAlchemy, and visualize some information from the data.
- EmployeeDb_Queries.sql contains the SQL queries used to do the data analyses.