The purpose of this project is to visualize the weather of 500+ cities across the world of varying distance from the equator.

- Python libraries:
- matplotlib.pyplot
- requests
- Pandas
- numpy
- time
- json
- scipy.stats
- OpenWeather API
- Jupyter Notebook
The objective is to build a series of scatter plots to showcase the following relationships:
- Temperature (F) vs. Latitude
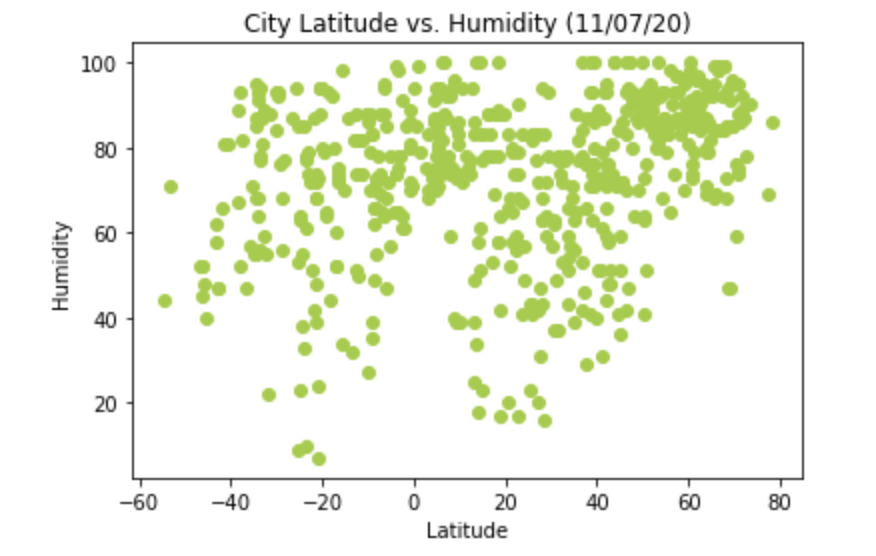
- Humidity (%) vs. Latitude
- Cloudiness (%) vs. Latitude
- Wind Speed (mph) vs. Latitude. Examples are shown below.

It is expected that the final Jupyter notebook must:
- Randomly select at least 500 unique (non-repeat) cities based on latitude and longitude.
- Perform a weather check on each of the cities using a series of successive API calls.
- Include a print log of each city as it's being processed with the city number and city name.
- Save both a CSV of all data retrieved and png images for each scatter plot.
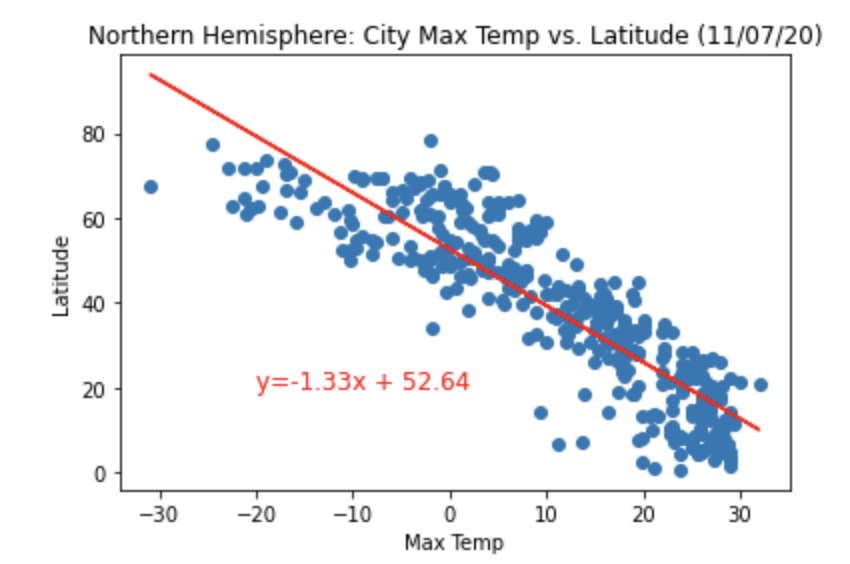
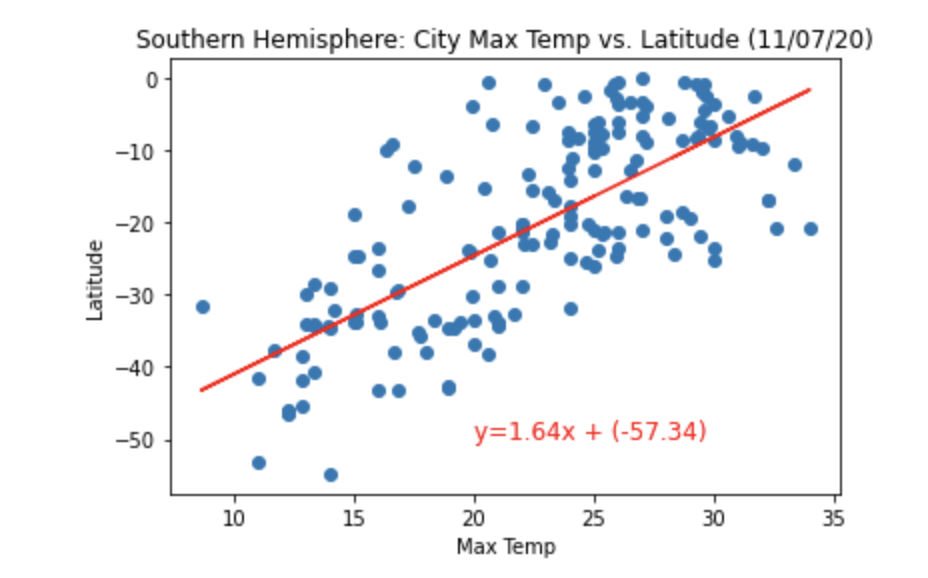
The notebook also contains the linear regression analyses performed on both Northern Hemisphere (greater than or equal to 0 degrees latitude) and Southern Hemisphere (less than 0 degrees latitude):
After each plot, I added a sentence or two explaining what the code is and analyzing:
- Northern Hemisphere - Temperature (F) vs. Latitude
- Southern Hemisphere - Temperature (F) vs. Latitude
- Northern Hemisphere - Humidity (%) vs. Latitude
- Southern Hemisphere - Humidity (%) vs. Latitude
- Northern Hemisphere - Cloudiness (%) vs. Latitude
- Southern Hemisphere - Cloudiness (%) vs. Latitude
- Northern Hemisphere - Wind Speed (mph) vs. Latitude
- Southern Hemisphere - Wind Speed (mph) vs. Latitude. Examples are shown below:
- To run this code, ensure that all the above libraries are installed in your environment.
- Pull all the file and data from this GitHub repository.
- To see the visualization and analyses, run the WeatherPy.ipynb file in Jupyter notebook.
- The WeatherPy.ipynb notebook contains the observations and insights from the analyses.
- The images folder contains the equatorsign.png used in the readme file.
- The starter_code folder contains the WeatherPy.ipynb and api_keys.py files.
- The WeatherPy.ipynb is a Jupyter notebook file that contains the Python code used to analyse the data.
- The api_keys.py is a Python file that contains the OpenWeather api key used to access the weather data on their website.
- The output_data folder contains all the figures (images) generated from the output of our analyses.