The correlation analysis is performed with Python and the process of analysis can be found in the GermanRestarauntsAnalysis.ipynb file.
The input data is taken from here: https://www.kaggle.com/datasets/mahnoorshahidshakir/best-restaurants-in-germany It contains information about the best restaraunts in Germany: price per person, number of stars, quality score, rank of the restaraunt, etc.
The original input file is uncleaned and contains data possibly from the web scraping. Before the correlation analysis the input file is cleaned and duplicates are removed.
The outcome of analysis is the Pearson's correlation matrix between different elements.
Correlation coefficient of more than 0.5 suggests about possible positive correlation. Correlation coefficient of less than -0.5 suggests about possible negative correlation. The closer it is to 1 or -1, the stronger is the correlation.
Red color means number is closer to 1, green color means number is closer to -1.
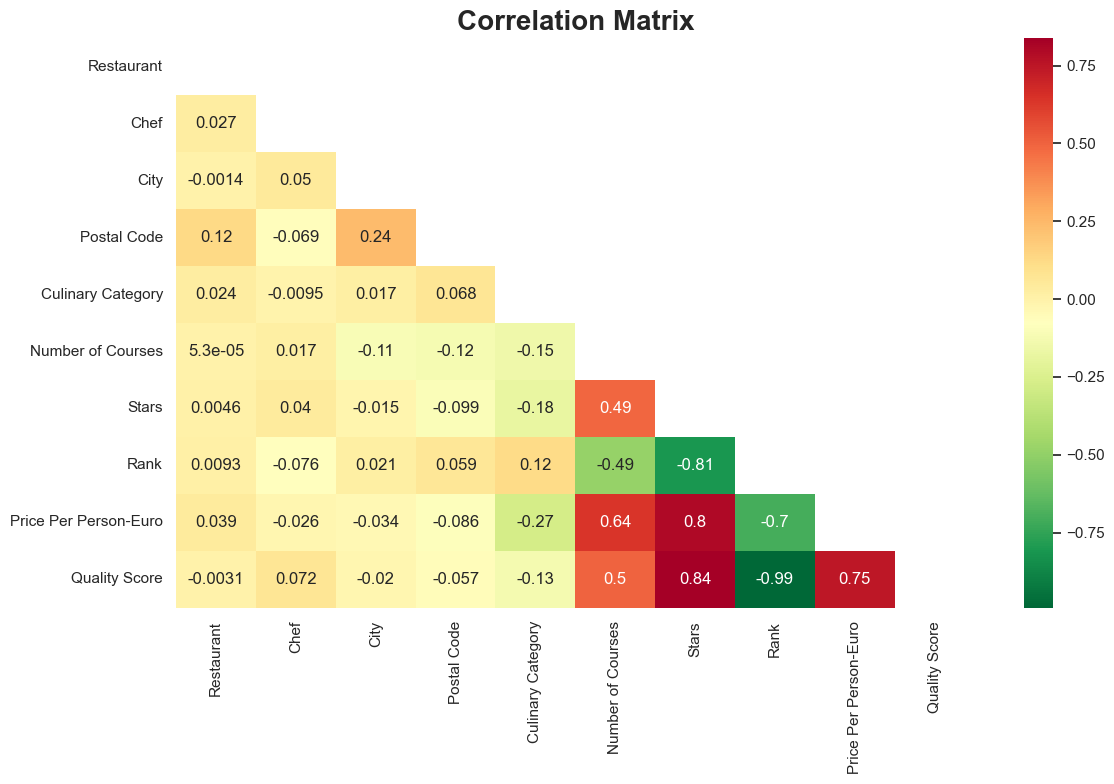
Question 1. What is the meaning of Rank values? With which parameters does it correlate?
Answer: We see the negative correlation between the rank and the quality score, number of stars. It means that the rank in the input list is not associated with those parameters. Moreover rank apperas to be the oppposite value to the quality score which indeed can be seen from the input file.

Question 2: Is the higher price and quality associated with the bigger number of stars?
Answer: yes. As we see from correlation matrix the number of stars correlates with the Quality Score (0.84) and the Price(0.8).
Question 3: Is the higher price associated with the bigger quality score?
Answer: yes. As we see from correlation matrix the Price and Quality score correlate with the coefficient 0.75.
Let's build the graphs that show relationships between number of stars, price and quality below.
