This is a COPY of the original repository which is under my partner's GitHub page linked here: https://github.com/ved-tiwari/AQI-Meter
View air quality, pollen, and weather statistics in 190+ countries. Designed to be easy to use for those who are interested in learning the air quality statistics in any city in the world.
As time progresses, our air quality continues to worsen at an ever alarming rate. Many factories and vehicles are emitting thousands of tons of emissions in the air and people who are living in places with more air pollution are suffering as a result. Myself and many others are concerned about the ongoing air quality issue. I was motivated to create this project because I noticed that there is not enough consolidated data that presents both pollutants and pollen markers in one app.
AQI Meter features a suite of unique features bundled in one software application which is unlike any other program
Here are just a few special features AQI Meter has to offer:
- Air quality information mapped on the globally used AQI (Air Quality Index) scale
- Health reccomendations tuned to the AQI value in the given area
- Individual pollutant concentrations including PM2.5, O3, PM10, and many more
- Weed, Tree, and Grass pollen concentrations
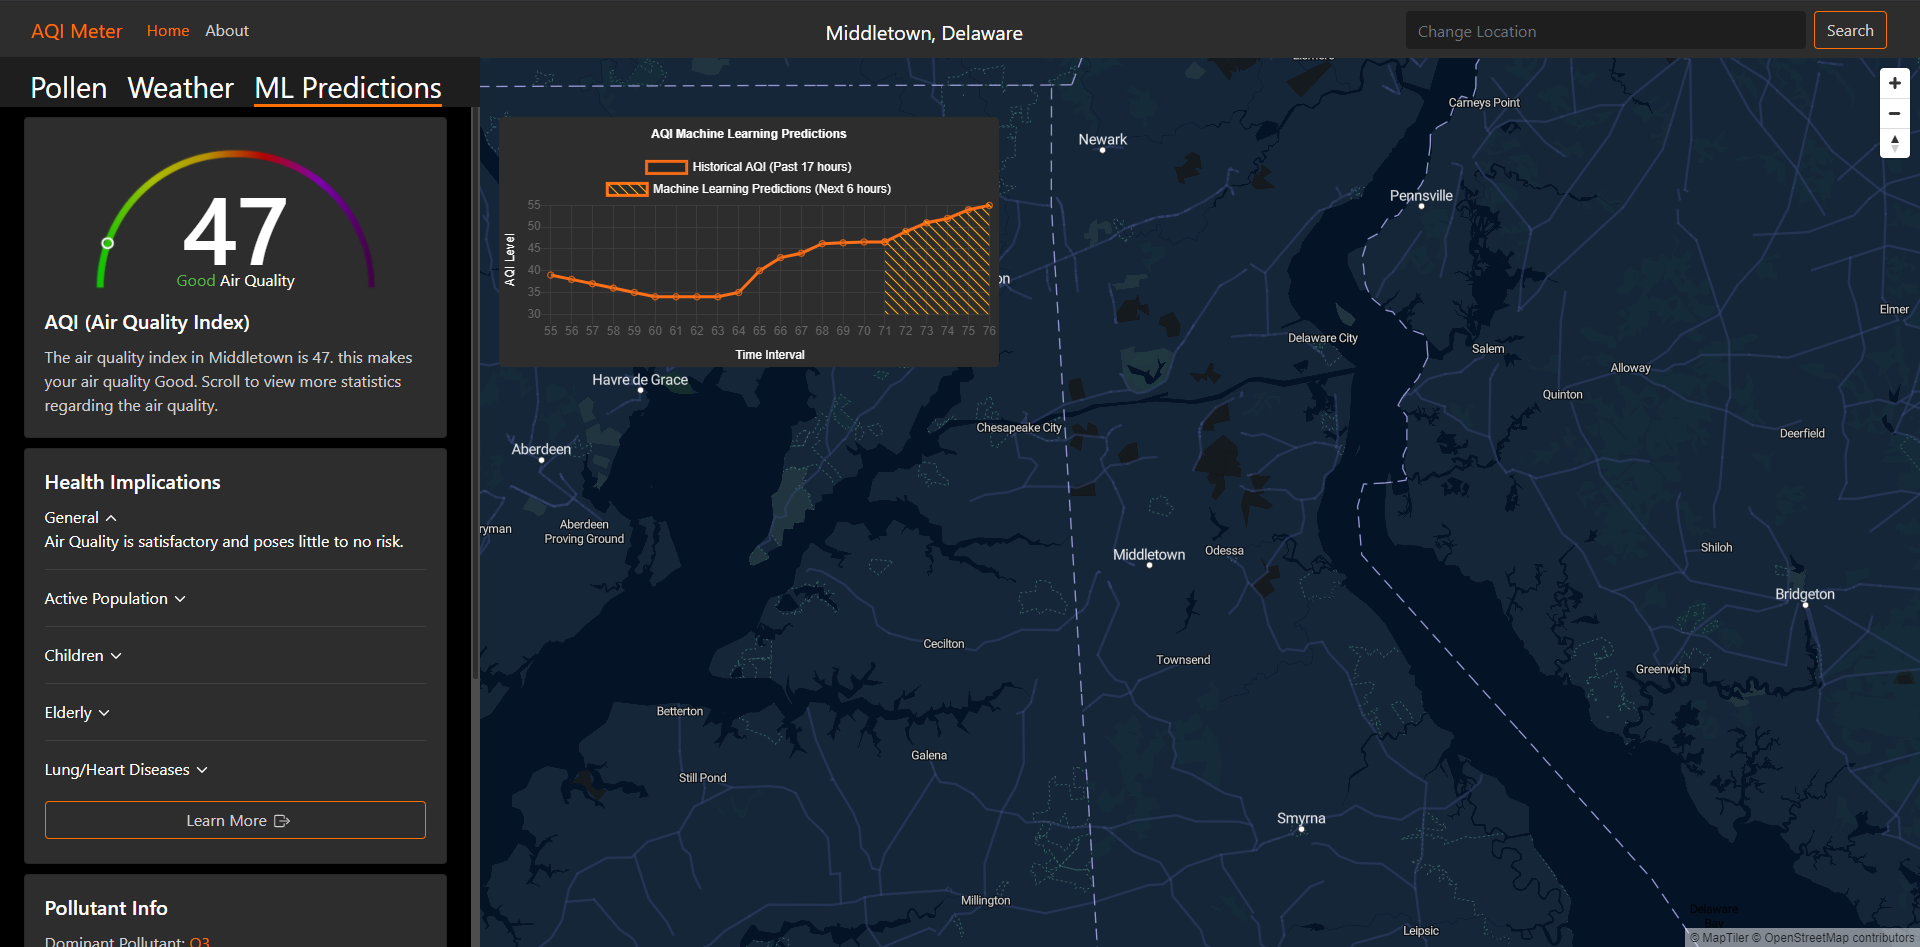
- AQI predictions for the next 6 hours using machine learning algorithms
- Weather informationin the given city including temperature, and precipitation, etc.
- Accurate information for almost every city in the world
AQI Meter uses a linear regression algorithm to predict future AQI values. The historical data for the past 17 hours is sent to the python backend via an AJAX call. Afterwords, the scikitlearn module for python predicts future air quality values for the next 6 hours. Then using jinja syntax provided with flask, the predictions are sent back to JavaScript to chart the data using the chartjs library.
- HTML/CSS/JavaScript
- chartJs
- jQuery
- Bootstrap
- Jinja
- Flask framework (Python)
- SciKitLearn Module
- Numpy Module