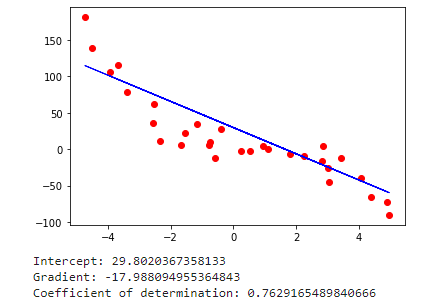
Task 1:
The file regression1.csv contains 100 pairs of values. The values in the first column are explanatory values/observations. The values in the second column are the corresponding response variable values. Python is used to obtain least squares regression to fit a line to the data and calculate the coefficient of determination (the 𝑅2 score) of the prediction. A plot is also generated to visualize the data.
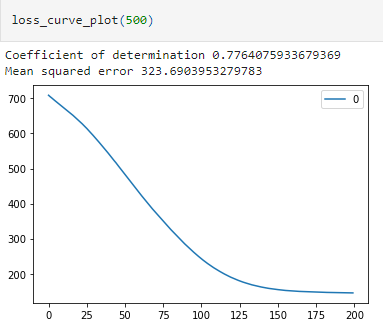
Task 2:
The file regression2.csv contains 500 rows of three values each. The values in the first and second column are explanatory variables/observations and the values in the third column are the corresponding response variable values. Decided to utilize a multi-layer perceptron (MLP) with a single hidden layer to fit a model to the data. One of the parameters that can be set up in MLP is the number of nodes in the hidden layer. The more nodes we have in the hidden layer, the more complexity that is captured in the model. It is known that model complexity increases the chances of overfitting. In the program I have investigated for the appropriate number of hidden nodes that provide the adequate model complexity and no overfitting. After narrowing down the optimal hidden node count the generalisation error is estimated for it.