A music streaming startup, Sparkify, has grown their user base and song database even more and want to move their data warehouse to a data lake. Their data resides in S3, in a directory of JSON logs on user activity on the app, as well as a directory with JSON metadata on the songs in their app.
In this project, we will build an ETL pipeline that extracts their data from S3, processes them using Spark, and loads the data back into S3 as a set of dimensional tables. This will allow their analytics team to continue finding insights in what songs their users are listening to.
Sparkify has made available two datasets that reside in S3.
-
Song data
The first dataset is a subset of real data from the Million Song Dataset. Each file is in JSON format and contains metadata about a song and the artist of that song. The files are partitioned by the first three letters of each song's track ID. And below is an example of what a single song file, TRAABJL12903CDCF1A.json, looks like.
{"num_songs": 1, "artist_id": "ARJIE2Y1187B994AB7", "artist_latitude": null, "artist_longitude": null, "artist_location": "", "artist_name": "Line Renaud", "song_id": "SOUPIRU12A6D4FA1E1", "title": "Der Kleine Dompfaff", "duration": 152.92036, "year": 0}
-
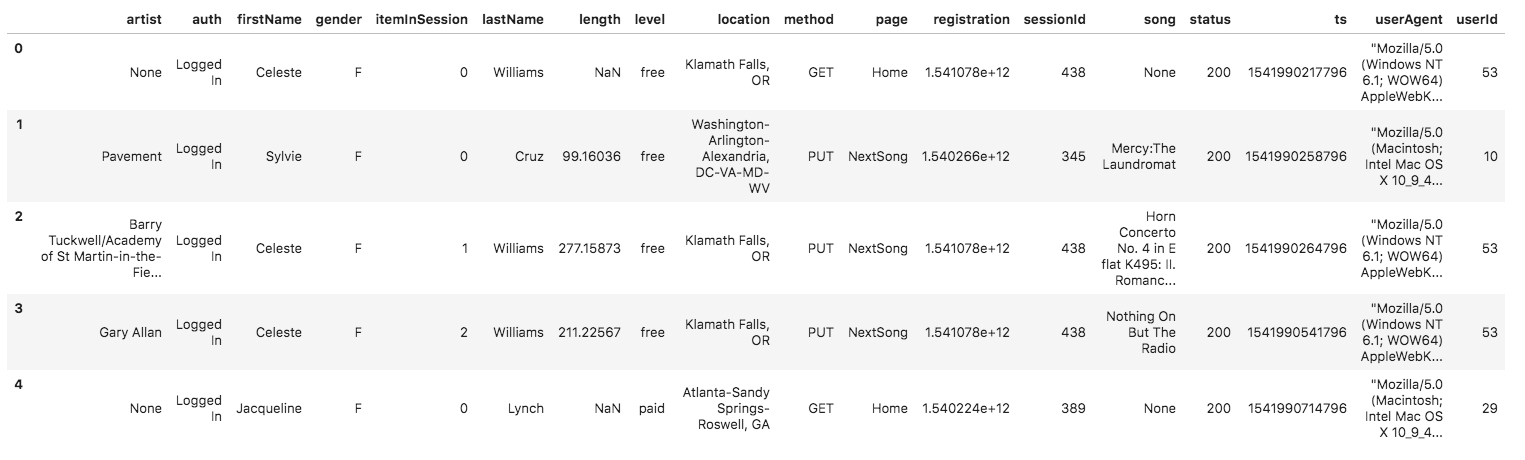
Log data
The second dataset consists of log files in JSON format generated by this event simulator based on the songs in the dataset above. These simulate app activity logs from an imaginary music streaming app based on configuration settings. Below is an example of what the data in a log file, 2018-11-12-events.json, looks like.
Using the song and log datasets, we create a star schema optimized for queries on song play analysis. This includes the following tables.
- Fact Table
- songplays - records in log data associated with song plays i.e. records with page NextSong songplay_id, start_time, user_id, level, song_id, artist_id, session_id, location, user_agent
- Dimension Tables
-
users - users in the app
user_id, first_name, last_name, gender, level
-
songs - songs in music database
song_id, title, artist_id, year, duration
-
artists - artists in music database
artist_id, name, location, lattitude, longitude
-
time - timestamps of records in songplays broken down into specific units
start_time, hour, day, week, month, year, weekday
ETL pipeline consists of processing the two datasets.
- Load data from song_data dataset
- Extract columns for songs and artist tables
- Write the data into parquet files which will be loaded on s3.
- Load data from log_data dataset
- Extract columns for users and time tables
- Read both the log_data and song_data datasets
- Extracts columns for songplays table with the data
- Save the data into parquet files which will be loaded on s3.
This script once executed retrieves the song and log data in the s3 bucket, transforms the data into fact and dimensional tables then loads the table data back into s3 as parquet files.
Will contain your AWS keys.
In order to have a copy of the project up and running locally, you will need to take note of the following:
-
Python 2.7 or greater.
-
AWS Account.
Set your AWS access and secret key in the config file.
[AWS]
AWS_ACCESS_KEY_ID = <your aws key>
AWS_SECRET_ACCESS_KEY = <your aws secret>
Make a new directory and clone/copy project files into it.
Download and install Apache Spark here https://spark.apache.org/downloads.html. Also ensure you have Java jdk8 installed locally.
Create a virtualenv that will be your development environment, i.e:
$ virtualenv data-lakes-project
$ source data-lakes-project/bin/activate
Install the following packages in your virtual environment:
- pyspark
Execute the ETL pipeline script by running:
$ python etl.py