Home
If you've ever found yourself debugging a ClickHouse issue or trying to
understand what's happening inside your database cluster, you know the
challenge: ClickHouse has an incredible universe of introspection tools, but
remembering all of them and jumping between different queries can be
overwhelming. That's where chdig comes in.
chdig is a terminal user interface (TUI) tool that brings together
ClickHouse's vast introspection capabilities into a single, intuitive
interface. Think of it as top for ClickHouse (or k9s for Kubernetes).
Instead of writing queries to check system tables, switching between terminal
windows, and trying to piece together what's happening in your cluster, chdig
gives you a unified view with real-time updates and powerful visualization
features.
The idea for chdig came from the everyday experience of digging into various
ClickHouse issues. ClickHouse has an incredibly comprehensive universe of
introspection capabilities through its system tables. From query profiling with
system.trace_log and system.stack_trace, to query execution details in
system.query_log and system.processes, to low-level metrics in dozens of
other system tables, ClickHouse gives you unparalleled visibility into what's
happening inside your database.
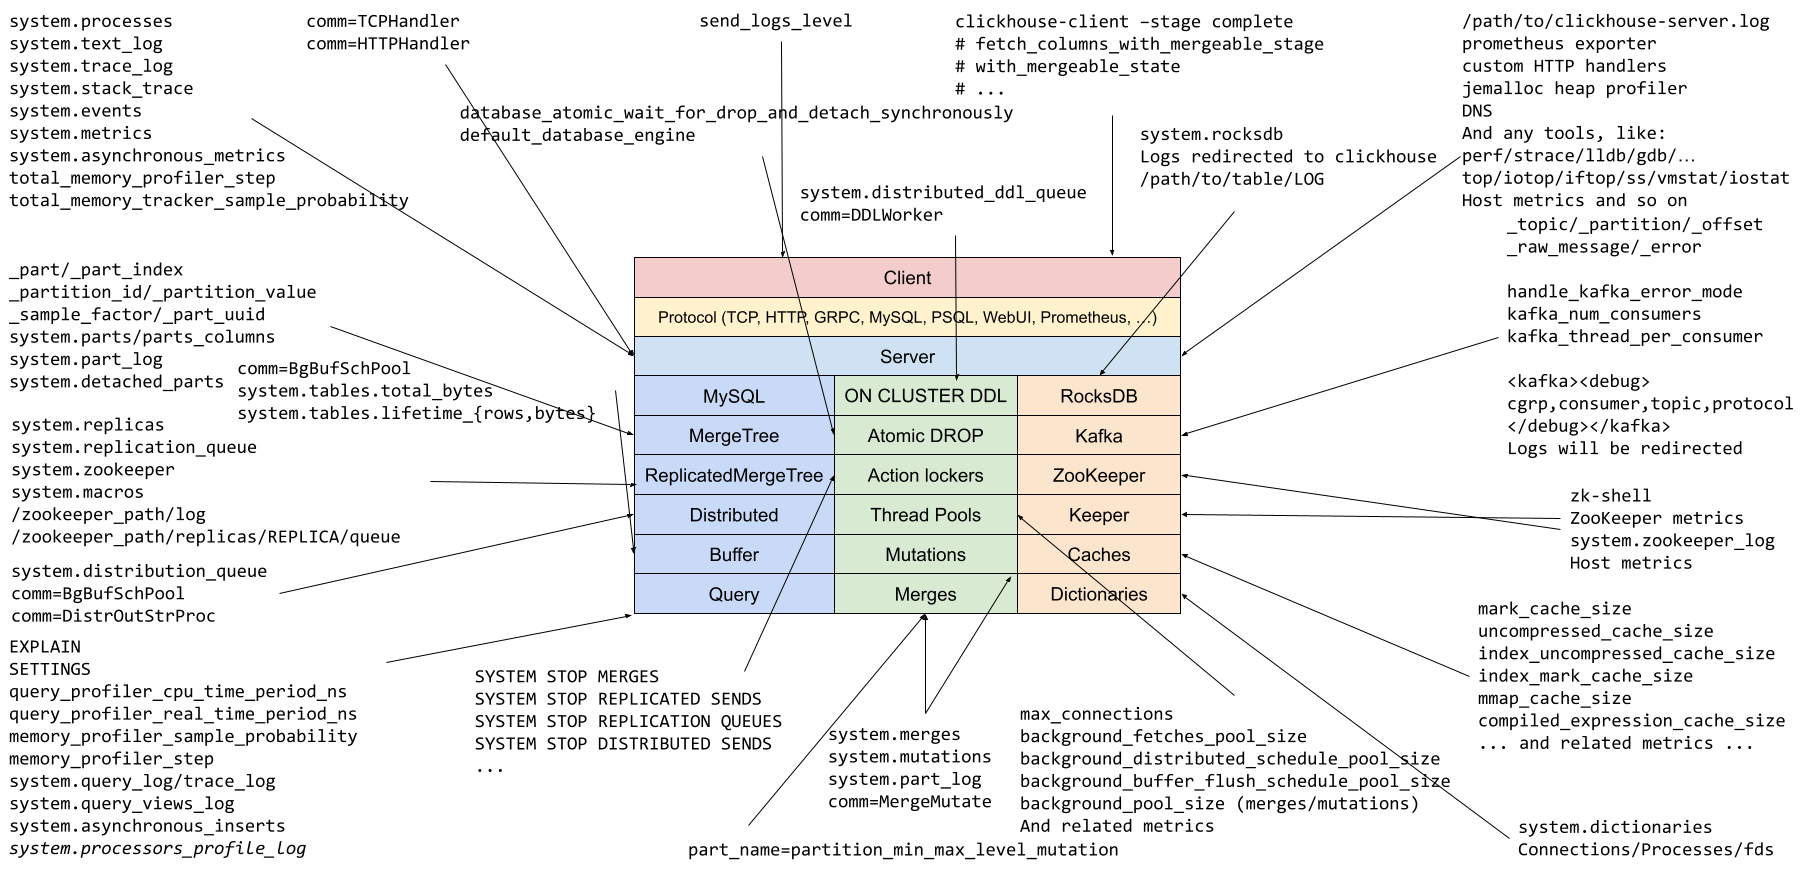
However, this richness comes with a challenge: there are tons of introspection
capabilities available. The "Know Your ClickHouse"
diagram
(inspired by Brendan Gregg's Linux performance tools) shows many of them, but it can be
tricky to remember all of them, and manually querying multiple tables to
correlate information can be tedious. Add to that the need to write date filters
for every system table query (WHERE event_time > now() - INTERVAL ...) to
avoid scanning massive amounts of historical data, and the friction adds up quickly.
chdig solves this by building on top of ClickHouse's excellent introspection
foundation and providing an interactive interface that does the heavy lifting
for you, making the introspection process simpler and more efficient.
Navigate through your ClickHouse queries, processes, metrics, tables, logs, and system diagnostics with an intuitive TUI that updates in real-time. See what's running, what's consuming resources, and what's happening across your cluster at a glance.
One of the most powerful features of chdig is its built-in flamegraph
support. You can visualize:
- CPU Flamegraphs: See where CPU time is being spent in your queries
- Real Flamegraphs: Understand overall execution patterns including wait times
- Memory Flamegraphs: Track memory allocations and identify memory hotspots
- Live Flamegraphs: Real-time visualization of what your server is doing right now
These flamegraphs use the same profiling data that ClickHouse collects through
system.trace_log and system.stack_trace, but present it in an interactive,
visual format that makes performance analysis much more intuitive.
Collaboration and issue reporting become significantly easier with chdig's
flamegraph sharing capability. When you encounter an interesting performance
pattern or need to discuss a query's behavior with colleagues, you can export
and share flamegraphs with just a few keystrokes.
To share a flamegraph, use any action with speedscope in its name (check the
actions menu or the shortcuts
documentation).
The flamegraph data is uploaded to pastila.nl (another
service powered by ClickHouse) and rendered using
speedscope.app, giving you a shareable URL that
anyone can view in their browser without needing ClickHouse or chdig
installed.
This is particularly useful for:
- Collaborative debugging: Share performance bottlenecks with team members
- Issue reporting: Attach flamegraphs to bug reports or support tickets
- Documentation: Include performance analysis in runbooks and post-mortems
- Knowledge sharing: Demonstrate query optimization techniques to colleagues
Note
Flamegraph data is uploaded to pastila.nl over HTTPS but is not end-to-end encrypted. Avoid sharing flamegraphs containing sensitive information such as customer data in stack traces or query parameters. End-to-end encryption support is being tracked in #202.
Debugging ClickHouse often means diving into server logs to understand what's
happening under the hood. chdig provides a rich log viewer that brings
ClickHouse's powerful logging capabilities into an interactive interface.
The log viewer features:
-
Syntax highlighting: Log messages are color-coded by severity level (trace,
debug, info, warning, error, fatal) using the same highlighting that
clickhouse-serverprovides, making it easy to spot issues at a glance - Advanced filtering: Filter logs by severity level, logger name, thread ID, query ID, and more. Quickly narrow down to the exact logs you need
- Real-time search: Search through logs with pattern matching to find specific events, errors, or operations
Beyond general server logs, chdig provides specialized log views for specific
operations: query execution logs, per-table operation logs, merge activity,
background task logs, and more. Each view is tailored to the context, showing
only the relevant information you need.
Whether you're tracking down a rare error, investigating slow query behavior, or monitoring system activity, the log viewer gives you the visibility you need without leaving the TUI. See the demo section for examples of log filtering and search in action.
In a ClickHouse cluster, metrics, logs, and query information are stored locally
on each shard. To get a complete picture, you typically need to manually collect
query_id (by initial_query_id) and query all shards using cluster() or
remote() functions, then correlate the results yourself.
chdig handles this automatically with the --cluster flag. It aggregates data
from all hosts in your cluster, giving you a unified view of what's happening
across your entire infrastructure without the manual overhead.
With the --history flag, chdig includes data from rotated system tables.
When ClickHouse changes the schema of a system table (like system.query_log),
it rotates the old table to a versioned name (e.g., system.query_log_1,
system.query_log_2).
chdig supports the same configuration files and connection options as
clickhouse-client, including:
- Configuration files (
XMLandYAML) - Named connections via
--connection(more info) - Environment variables for credentials
- Secure connections with TLS
This means if you're already using clickhouse-client, you can use your
existing configurations with chdig, by just substituting clickhouse-client
with chdig.
Getting started with chdig is straightforward. Pre-built packages are
available for Linux, macOS and Windows:
# For macOS with Homebrew
brew install chdig

# For Arch Linux
yay -S chdig-latest-bin

# For Windows with Scoop
scoop bucket add extras
scoop install extras/chdig

# Or download pre-built binaries from GitHub releases
# https://github.com/azat/chdig/releases
Once installed, connect to your ClickHouse instance:
chdigchdig version for this demo was 25.12

Let's walk through some real-world scenarios to see chdig in action.

Note: the terminal capture is converted to gif here. Click the link to use the interactive player where you can pause and navigate.
Here's the workflow:
- Opened "Last queries"
- Filtered by
%azat%to show only queries executed by me in the last hour - Removed unnecessary columns (middle mouse button)
- Resized columns (drag with mouse)
Now let's dig into a particular query:
- Read logs for the query execution
- Looked at
DB::Exceptionentries for any errors - Filtered by specific logger (
executeQuery) to focus on query execution - Query profile events - ProfileEvents from system.query_log displayed as a table
- Query details - all columns including previously removed ones
- CPU flamegraph: 42% executing functions, 33% aggregation, 20% reading
- Real time flamegraph shows the difference: ~4% reading from network (not visible in CPU flamegraph since network I/O doesn't consume CPU while polling)
-
EXPLAIN SYNTAX- nicely formatted query -
EXPLAIN PLAN- query execution plan -
EXPLAIN PIPELINE- pipeline visualization - Query processors - confirms the proportions seen in the CPU flamegraph
chdig is written in Rust, leveraging several excellent libraries:
- cursive: For the terminal UI framework
- clickhouse-rs: For database connectivity
- flamelens: For interactive flamegraph rendering
- And other well known crates
The tool queries ClickHouse's system tables like system.processes,
system.query_log, system.trace_log, and many others, then presents the data
in an organized, interactive format.
It's also a single static binary, making it very easy to use.
An interesting aspect of developing chdig has been the feedback loop with
ClickHouse itself. While building this tool and exploring various introspection
use cases, several gaps in ClickHouse's observability became apparent. This led
to contributions back to ClickHouse to enhance its introspection capabilities:
- Additional metrics and system table fields
- Improved profiling data granularity
- Better exposure of internal state for monitoring
This symbiotic relationship means that chdig not only benefits from
ClickHouse's rich introspection features but also helps drive improvements in
those features, making ClickHouse itself more observable for everyone.
chdig is actively developed and worth giving a try. It's being used in
production environments and is also available as part of the official
ClickHouse distribution via clickhouse chdig, though that version may be
slightly behind the latest releases.
chdig is open source and available on
GitHub. The project welcomes contributions,
bug reports, and feature requests.
If you work with ClickHouse, chdig is a tool worth adding to your toolkit. It
transforms the experience of monitoring and debugging ClickHouse from juggling
multiple queries and terminal windows into a streamlined, interactive
experience. Whether you're debugging a performance issue, monitoring production
systems, or just exploring what your database is doing, chdig provides the
visibility you need with the efficiency you want.
Give it a try, and discover just how much easier ClickHouse introspection can be.