latest
NOTE: I'm working at Splunk, but this is not an official Splunk images. I build them in my free time when I'm not at work. I have some knowledge about Splunk, but you should think twice before putting them in production. I run these images on my own home server just for my personal needs. If you have any issues - feel free to open a bug.
Dockerfile to build Splunk Light image with predefined dashboards which work great with docker-stats-splunk-forwarder.
- Splunk Light:
6.2.5
Pull the image from the docker registry. This is the recommended method of installation as it is easier to update image. These builds are performed by the Docker Trusted Build service.
docker pull outcoldman/docker-stats-splunk:latestOr you can pull latest version.
docker pull outcoldman/docker-stats-splunk:latestAlternately you can build the image locally.
git clone https://github.com/outcoldman/docker-stats-splunk.git
cd docker-stats-splunk
docker build --tag="$USER/docker-stats-splunk" .To manually start container (see more details in description for outcoldman/splunk and outcoldman/docker-stats-splunk-forwarder images)
docker run --name vsplunk \
    -v /opt/splunk/etc \
    -v /opt/splunk/var \
    busybox
docker run --hostname splunk \
    --name splunk \
    --volumes-from=vsplunk \
    -p 8000:8000 \
    -d outcoldman/docker-stats-splunk:latest
docker run --hostname dockerforwarder \
    --name dockerforwarder \
    --link=splunk \
    --volume /var/run/docker.sock:/var/run/docker.sock:r \
    -e "SPLUNK_FORWARD_SERVER=splunk:9997" \
    -d outcoldman/docker-stats-splunk-forwarder:latest
Or if you use docker-compose
vsplunk:
  image: busybox
  volumes:
    - /opt/splunk/etc
    - /opt/splunk/var

splunk:
  image: outcoldman/docker-stats-splunk:latest
  hostname: splunk
  volumes_from:
    - vsplunk
  ports:
    - 8000:8000

dockerforwarder:
  image: outcoldman/docker-stats-splunk-forwarder:latest
  hostname: dockerforwarder
  volumes:
    - /var/run/docker.sock:/var/run/docker.sock:ro
  links:
    - splunk
  environment:
- SPLUNK_FORWARD_SERVER=splunk:9997See docker-splunk for more details.
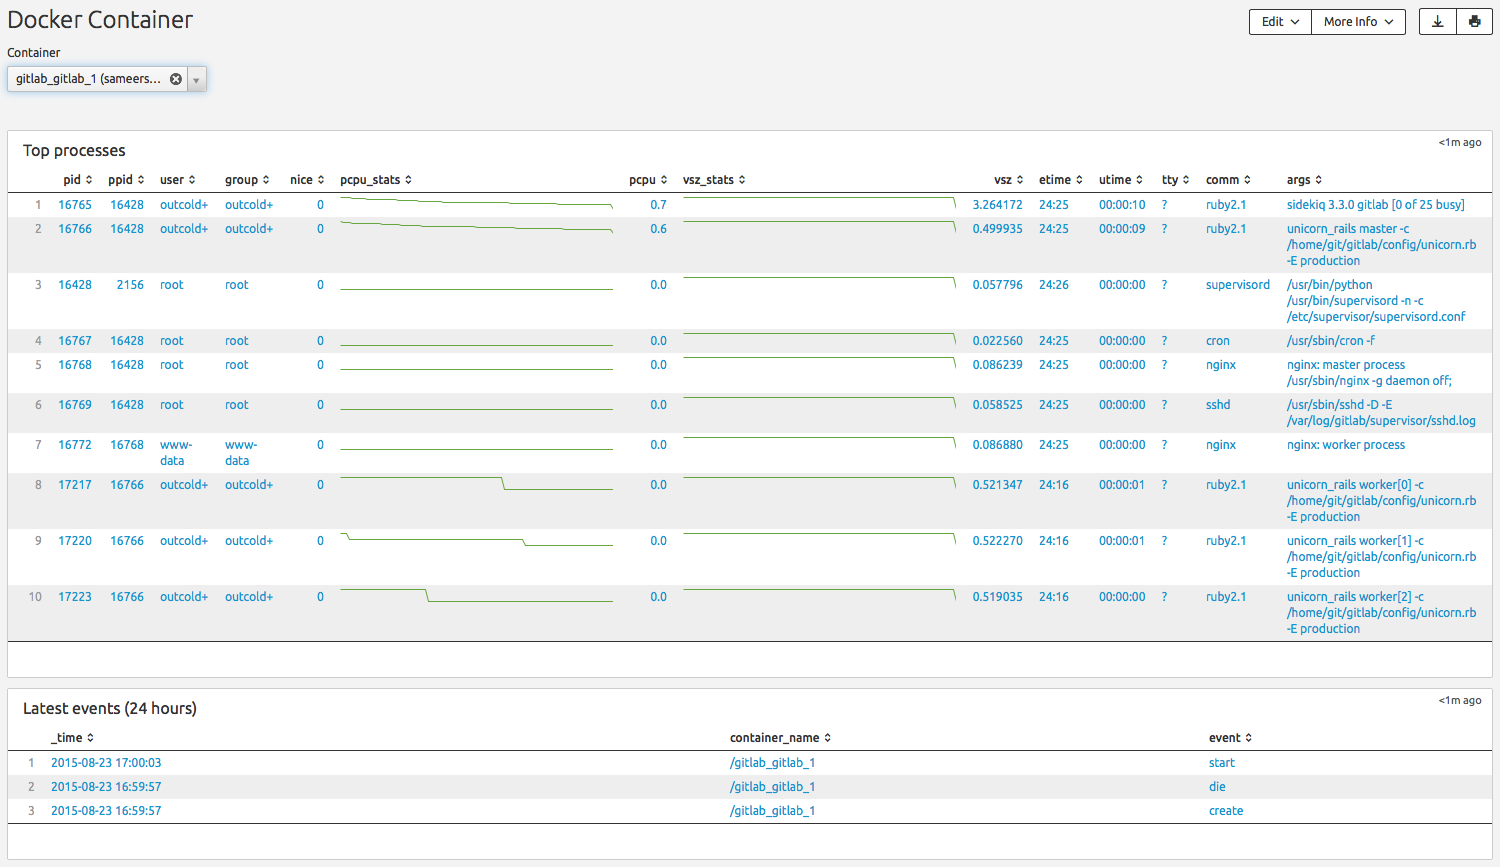
Open Splunk (port 8000 is used by default for web interface), go to the Dashboards
and you will see 2 Dashboards.
- CPU% (800% because of 8 cores)
- Memory Usage (one line is the maximum limit, another is how much is used right now)
- CPU usage per container
- Memory Usage per container (% of limit)
- Network Input per container
- Network Output per container
- Last Events (excluding
topas I query it regularly) - Top processes from all container

- Top processes
- Last events