Performing analysis on Kickstarter data to uncover trends
###challenge
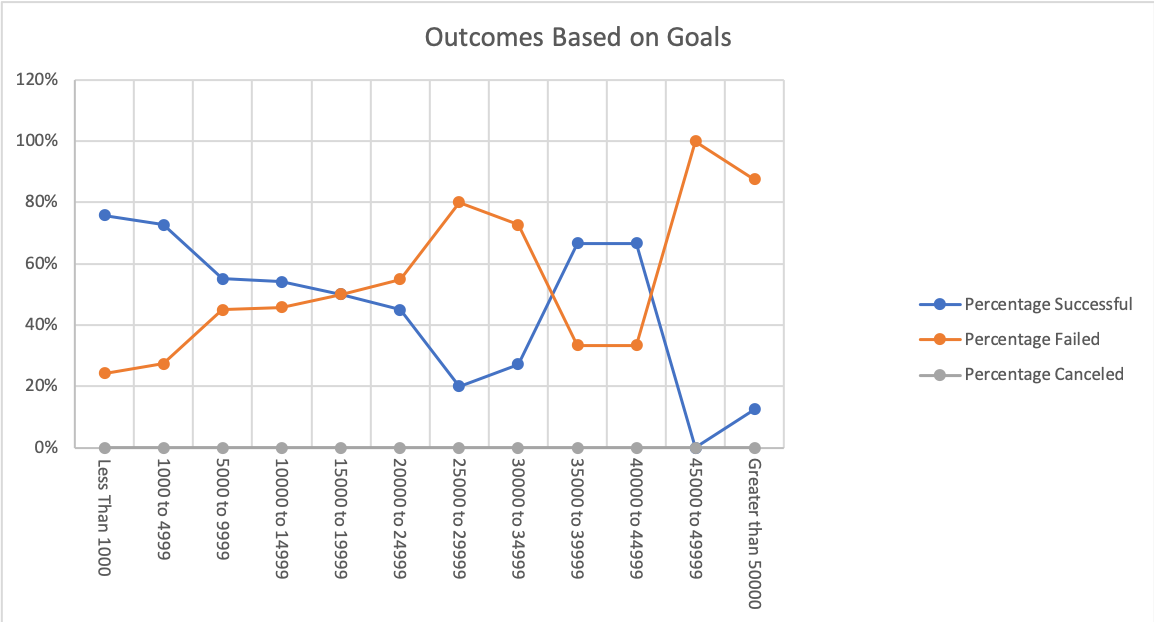 The image above shows the Percentage of three different outcomes( successful, failed, cancel) in different range of goals. According to the request from the module, only play subcategories. The number of cancel outcomes in this subcategories is 0. so the line was in 0.
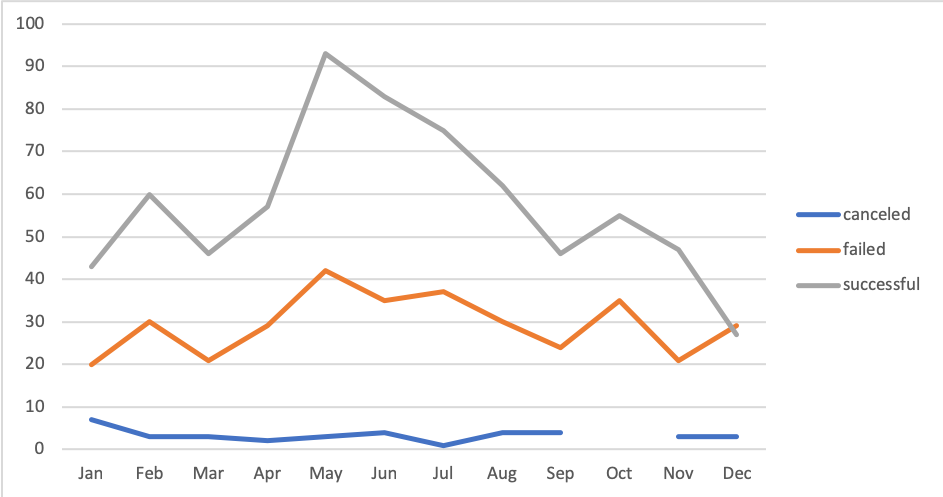
The image above shows the Outcomes percentage ( sucessful, failed, cancel) at different launch date. From the plot we can see the highest percentage among 12-months is the successful outcome. Between May and July the successful outcome is the highest. Between september to November, there has no canceled outcome, which causing the plot to have a gap.