
LIDA is a library for generating data visualizations and data-faithful infographics. LIDA is grammar agnostic (will work with any programming language and visualization libraries e.g. matplotlib, seaborn, altair, d3 etc) and works with multiple large language model providers (OpenAI, Azure OpenAI, PaLM, Cohere, Huggingface). Details on the components of LIDA are described in the paper here and in this tutorial notebook. See the project page here for updates!.
Note on Code Execution: To create visualizations, LIDA generates and executes code. Ensure that you run LIDA in a secure environment.
LIDA treats visualizations as code and provides a clean api for generating, executing, editing, explaining, evaluating and repairing visualization code.
- Data Summarization
- Goal Generation
- Visualization Generation
- Visualization Editing
- Visualization Explanation
- Visualization Evaluation and Repair
- Visualization Recommendation
- Infographic Generation (beta) # pip install lida[infographics]
from lida import Manager, llm

lida = Manager(text_gen = llm("openai")) # palm, cohere ..
summary = lida.summarize("data/cars.csv")
goals = lida.goals(summary, n=2) # exploratory data analysis
charts = lida.visualize(summary=summary, goal=goals[0]) # exploratory data analysisSetup and verify that your python environment is python 3.10 or higher (preferably, use Conda). Install the library via pip.
pip install -U lida LIDA depends on llmx and openai. If you had these libraries installed previously, consider updating them.
pip install -U llmx openaiOnce requirements are met, setup your api key. Learn more about setting up keys for other LLM providers here.
export OPENAI_API_KEY=<your key>Alternatively you can install the library in dev model by cloning this repo and running pip install -e . in the repository root.
LIDA comes with an optional bundled ui and web api that you can explore by running the following command:
lida ui --port=8080 --docsThen navigate to http://localhost:8080/ in your browser. To view the web api specification, add the --docs option to the cli command, and navigate to http://localhost:8080/api/docs in your browser.
The fastest and recommended way to get started after installation will be to try out the web ui above or run the tutorial notebook.
The LIDA web api and ui can be setup using docker and the command below (ensure that you have docker installed, and you have set your OPENAI_API_KEY environment variable).
docker compose upGiven a dataset, generate a compact summary of the data.
from lida import Manager

lida = Manager()
summary = lida.summarize("data/cars.json") # generate data summaryGenerate a set of visualization goals given a data summary.
goals = lida.goals(summary, n=5, persona="ceo with aerodynamics background") # generate goalsAdd a persona parameter to generate goals based on that persona.
Generate, refine, execute and filter visualization code given a data summary and visualization goal. Note that LIDA represents visualizations as code.
# generate charts (generate and execute visualization code)
charts = lida.visualize(summary=summary, goal=goals[0], library="matplotlib") # seaborn, ggplot ..Given a visualization, edit the visualization using natural language.
# modify chart using natural language
instructions = ["convert this to a bar chart", "change the color to red", "change y axes label to Fuel Efficiency", "translate the title to french"]
edited_charts = lida.edit(code=code, summary=summary, instructions=instructions, library=library, textgen_config=textgen_config)Given a visualization, generate a natural language explanation of the visualization code (accessibility, data transformations applied, visualization code)
# generate explanation for chart
explanation = lida.explain(code=charts[0].code, summary=summary)Given a visualization, evaluate to find repair instructions (which may be human authored, or generated), repair the visualization.
evaluations = lida.evaluate(code=code, goal=goals[i], library=library)Given a dataset, generate a set of recommended visualizations.
recommendations = lida.recommend(code=code, summary=summary, n=2, textgen_config=textgen_config)Given a visualization, generate a data-faithful infographic. This methods should be considered experimental, and uses stable diffusion models from the peacasso library. You will need to run pip install lida[infographics] to install the required dependencies.
infographics = lida.infographics(visualization = charts[0].raster, n=3, style_prompt="line art")LIDA uses the llmx library as its interface for text generation. llmx supports multiple local models including HuggingFace models. You can use the huggingface models directly (assuming you have a gpu) or connect to an openai compatible local model endpoint e.g. using the excellent vllm library.
!pip3 install --upgrade llmx==0.0.17a0

# Restart the colab session

from lida import Manager
from llmx import  llm
text_gen = llm(provider="hf", model="uukuguy/speechless-llama2-hermes-orca-platypus-13b", device_map="auto")
lida = Manager(text_gen=text_gen)
# now you can call lida methods as above e.g.
sumamry = lida.summarize("data/cars.csv") # ....
Using an OpenAI Compatible Endpoint e.g. vllm server
from lida import Manager, TextGenerationConfig , llm

model_name = "uukuguy/speechless-llama2-hermes-orca-platypus-13b"
model_details = [{'name': model_name, 'max_tokens': 2596, 'model': {'provider': 'openai', 'parameters': {'model': model_name}}}]

# assuming your vllm endpoint is running on localhost:8000
text_gen = llm(provider="openai",  api_base="http://localhost:8000/v1", api_key="EMPTY", models=model_details)
lida = Manager(text_gen = text_gen)- LIDA generates and executes code based on provided input. Ensure that you run LIDA in a secure environment with appropriate permissions.
- LIDA currently works best with datasets that have a small number of columns (<= 10). This is mainly due to the limited context size for most models. For larger datasets, consider preprocessing your dataset to use a subset of the columns.
- LIDA assumes the dataset exists and is in a format that can be loaded into a pandas dataframe. For example, a csv file, or a json file with a list of objects. In practices the right dataset may need to be curated and preprocessed to ensure that it is suitable for the task at hand.
- Smaller LLMs (e.g., OSS LLMs on Huggingface) have limited instruction following capabilities and may not work well with LIDA. LIDA works best with larger LLMs (e.g., OpenAI GPT 3.5, GPT 4).
- How reliable is the LIDA approach? The LIDA paper describes experiments that evaluate the reliability of LIDA using a visualization error rate metric. With the current version of prompts, data summarization techniques, preprocessing/postprocessing logic and LLMs, LIDA has an error rate of < 3.5% on over 2200 visualizations generated (compared to a baseline of over 10% error rate). This area is work in progress.
- Can I build my own apps with LIDA? Yes! You can either use the python api directly in your app or setup a web api endpoint and use the web api in your app. See the web api section for more details.
- How is LIDA related to OpenAI Code Interpreter: LIDA shares several similarities with code interpreter in the sense that both involve writing and executing code to address user intent. LIDA differs in its focus on visualization, providing a modular api for developer reuse and providing evaluation metrics on the visualization use case.
Naturally, some of the limitations above could be addressed by a much welcomed PR.
- LIDA + Streamlit: lida-streamlit,
A short paper describing LIDA (Accepted at ACL 2023 Conference) is available here.
@inproceedings{dibia2023lida,
    title = "{LIDA}: A Tool for Automatic Generation of Grammar-Agnostic Visualizations and Infographics using Large Language Models",
    author = "Dibia, Victor",
    booktitle = "Proceedings of the 61st Annual Meeting of the Association for Computational Linguistics (Volume 3: System Demonstrations)",
    month = jul,
    year = "2023",
    address = "Toronto, Canada",
    publisher = "Association for Computational Linguistics",
    url = "https://aclanthology.org/2023.acl-demo.11",
    doi = "10.18653/v1/2023.acl-demo.11",
    pages = "113--126",
}
LIDA builds on insights in automatic generation of visualization from an earlier paper - Data2Vis: Automatic Generation of Data Visualizations Using Sequence to Sequence Recurrent Neural Networks.
LIDA降低数据可视化门槛的工具,利用LLM的推理能力,构建了从原始数据到可视化图表的工作流。
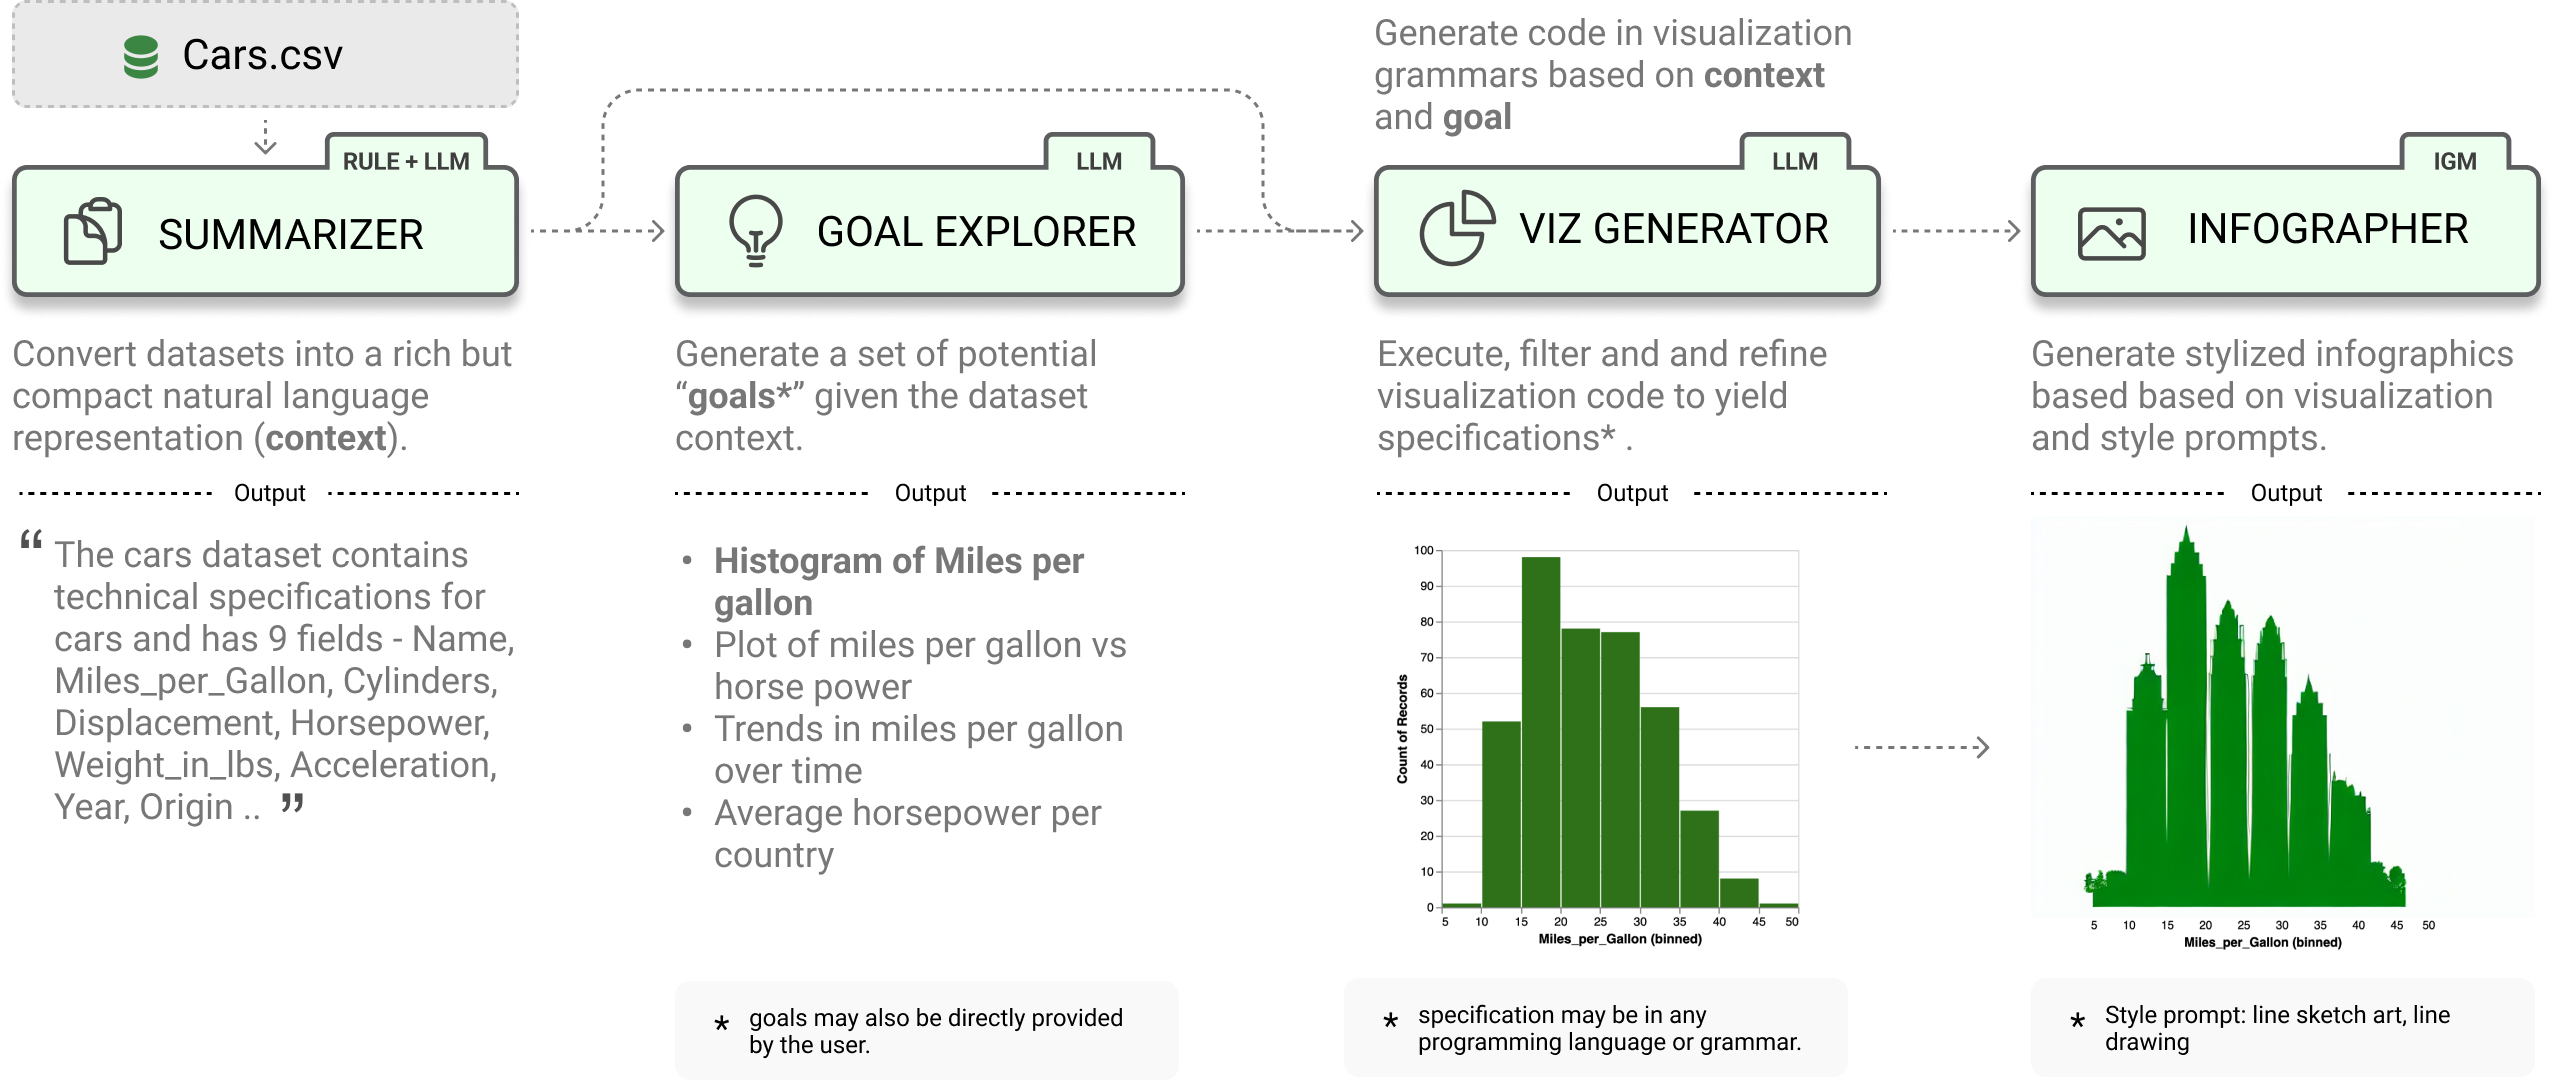
核心价值在于将图表生成任务拆解为4个由LLM驱动的顺序模块:
SUMMARIZER(数据总结): 将原始数据集抽象为富文本描述(包含字段语义、分布特征等),为 LLM 提供必要的上下文背景。
GOAL EXPLORER(目标制定): 基于数据摘要,自动生成具体的可视化目标。
VIS GENERATOR(代码生成): 将目标转化为可执行的代码脚本。LLM 在此环节展现了强大的逻辑编排能力。
INFOGRAPHER(风格化与美化): 利用生成式 AI 对图表进行艺术加工,使其具备信息图(Infographics)的视觉吸引力。
- 提供自然语言处理模块、可见性功能来控制系统行为,才能降低目标人群的使用门槛。
研究发现:LLM在可视化领域的几个特征:
-
声明式语法的优势:LLM容易理解
-
Summary 模块的启示:数据概览(Summary)不仅是给用户看的,更是 Prompt Engineering 的关键。它能有效帮助 AI 建立对数据驱动型任务的“全局观”,显著提升后续生成的准确性。值得注意的是,基于summary再次进行semantic_type 和 description 的prompt,精度会略微提升。这可能是由于LLM的基础模型中,文本是热词,而数字是"长尾",在向量空间中内在意义不显著。
研究局限/未来发展:
尽管 LIDA 展示了巨大的潜力,但在实际落地中仍面临挑战:
-
幻觉问题(Hallucination):LLM 有时会臆造数据趋势或生成错误的统计逻辑,这在严谨的数据可视化领域是致命的。
-
成本与响应延迟:频繁调用顶级 LLM 成本高昂,且网络延迟严重影响了交互式探索的体验。
-
用户体验瓶颈:因幻觉导致的错误修正、重复上传验证等流程极大降低了用户满意度。
业界急需研发规模更小、领域针对性更强的可视化图表基础模型,适用创造性任务。 或者,如何区分创造性任务和严谨的可视化任务呢?