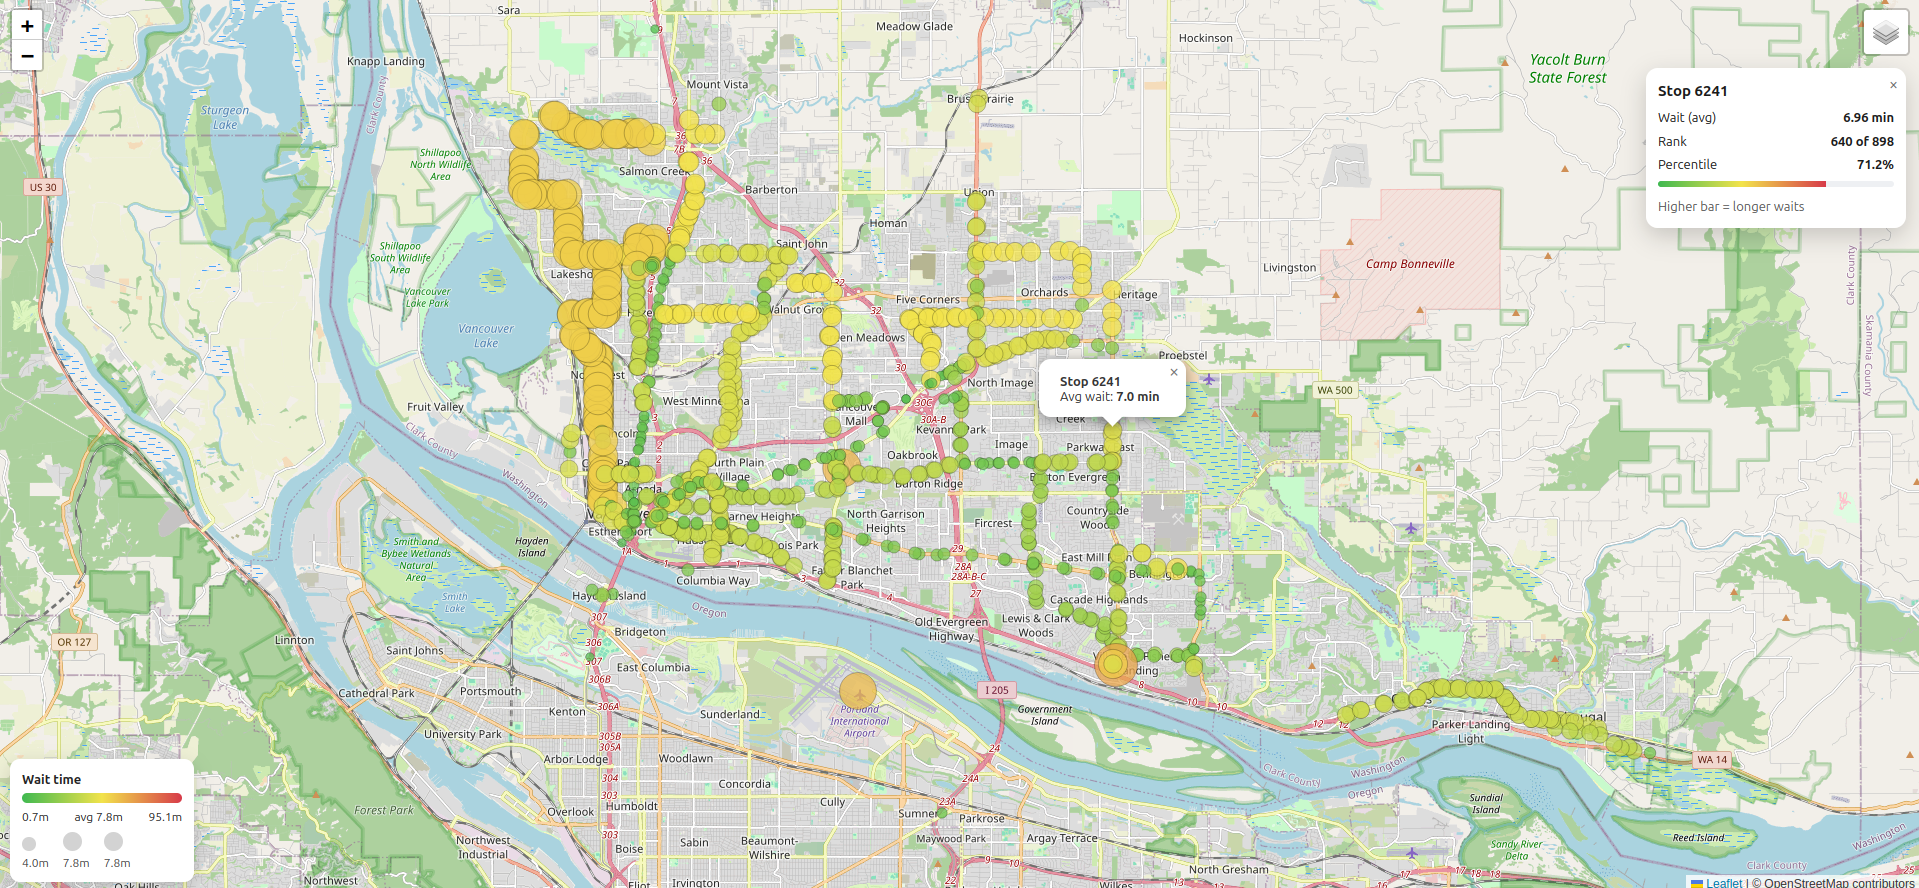
An interactive map visualizing average passenger wait times at C-TRAN bus stops in Vancouver, Washington, calculated from publicly available GTFS schedule data.
This project turns raw GTFS data into a stop-level dataset and interactive map. The Python script loads stops.txt and stop_times.txt, normalizes GTFS times that roll past midnight, converts them to datetimes and sorts by stop_id and arrival time.
For each stop it computes the gap to the next arrival, averages those stretches to estimate typical rider wait in minutes, joins in latitude/longitude from stops.txt and writes a compact wait_time_per_stop.csv for mapping and analysis.
The HTML page renders that CSV file onto a Leaflet base map with a D3 overlay. Each stop appears as a scalable bubble whose size and color encode average wait, with fast, debounced re-projection on pan and zoom. Hover tooltips show stop ID and wait; clicking opens an info panel with exact wait, rank, percentile and a meter bar. A built-in legend also summarizes the color ramp and bubble sizes.
Below are the required software programs and set up steps for using this application.
-
Install the above programs
-
Open a terminal
-
Clone this repository using
gitby running the following command:git clone git@github.com:devbret/c-tran-wait-times.git -
Navigate to the repo's directory by running:
cd c-tran-wait-times -
Create a virtual environment with this command:
python3 -m venv venv -
Activate your virtual environment using:
source venv/bin/activate -
Install the needed dependencies for running the script:
pip install -r requirements.txt -
Download the source GTFS schedule data from the C-TRAN website
-
Add/move the
stops.txtandstop_times.txtfiles to this directory -
Process the data with the following command:
python3 app.py -
To view the frontend data visualization using the index.html file you will need to run the following command in a new terminal:
python3 -m http.server
The purpose of this repo is to demonstrate an ability to do the follwoing:
-
Locate and process relevant public data
-
Tell a story with data visualization technologies
If you found this project interesting, please feel free to visit my website and reach out. It would be interesting to hear from others who are using D3.js to work with publicly available data.