Metric Track | Authors: Gian Favero and Michael Montemurri, Mila, 2024
In football analytics, conventional metrics often focus on high-level outcomes such as points scored, turnovers, and yards, though this is rarely done considering the context of the plays leading to those results. A play's success depends on a variety of factors: the game situation, offensive strategy, defensive alignment, and the specific play call itself. In this work, we propose a new methodology to analyze play outcomes by leveraging a pre-trained large language model (LLM) that integrates pre-snap game, offensive and defensive contexts, as well as the play call itself. We train a regressor head to predict xYards, an analytical tool from which a novel performance metric is derived:
- Expected Yards Gained (xYards): The predicted yardage that will likely be achieved based on the specific play context and play call.
- Yards Gained over Expected (YGoE): An offensive players' or team's ability to outperform their xYards value.
In blending natural language processing with sports statistics, this approach aims to provide deeper insights into the factors that drive offensive success in football.

We trained a regression model on top of the BERT architecture to predict expected yards gained for NFL plays based on pre-snap information. The training dataset was constructed from pre- and post-snap data collected during the first 10 weeks of the 2022 NFL season. Each input consisted of situational game context, along with offensive and defensive contexts, which were transformed into natural language prompts (ie. a sentence that could be fed into ChatGPT). These prompts are player-agnostic, enabling the model to predict xYards solely based on the specified contexts. This design allows us to use a player's deviation from the model's predicted output as a metric in itself.
- Game Context: We captured details such as the quarter, down, yards to go, yardline position, game clock, team scores, possession, and current win probability for both home and visitor teams.
- Offensive Context: Features related to the offensive team’s formation and receiver alignment were extracted, which describe how the offense is positioned at the time of the play.
- Defensive Context: We included details on the defensive team’s formation and pass coverage, along with the number of pass rushers from various positions (cornerbacks, safeties, linebackers, etc.) derived using a series of XGBoost models based on the winning Coaches' Track submission from 2023, xPassRush [1].
- Play Context: Play choices were simplified into a series of run concepts (power, zone, misdirection, and trick) and pass concepts (depth, area of field, play action.
- Outcome Context: The yards gained on the play were used as labels to train the model.
Various plays were removed from the dataset to reduce noise during training. These include plays involving a QB kneel, spike, or sneak. Plays that involve a QB sack are removed, as there is no realistic method of knowing what the intended play call was. Additionally, plays that occur when one team has a greater than 95% win probability are removed from training to avoid models learning from "garbage time" statistics that are conventionally deemed non-meaningful.
In our experiments we compared 2 pre-trained LLMs against an XGBoost baseline on predicting yards gained when given detailed pre-snap data. For the BERT-based models, the pre-snap data was provided as a sentence prompt, while the data was kept in tabular format for the XGBoost baseline.
BERT (Bidirectional Encoder Representations from Transformers): BERT [2] is a transformer-based language model developed by Google, designed to understand the context of words in a sentence by analyzing them bidirectionally. It's widely used for natural language understanding tasks.
SportsBERT: SportsBERT is a domain-specific adaptation of BERT, fine-tuned on sports-related text data.
Baseline (XGBoost): XGBoost [3] is a gradient boosting algorithm widely used for classification and regression on tabular data.

The ground truth validation data contains some variation in the yardsGained labels, covering a standard deviation of 8.69 yards. All three models achieved RMSE values within one standard deviation bound, providing some validity to their performance. The SportsBERT regressor demonstrated the lowest RMSE in xYards predicted compared to the base BERT model and the XGBoost baseline. Consequently, in subsequent experiments the SportsBERT variant of the model was used.
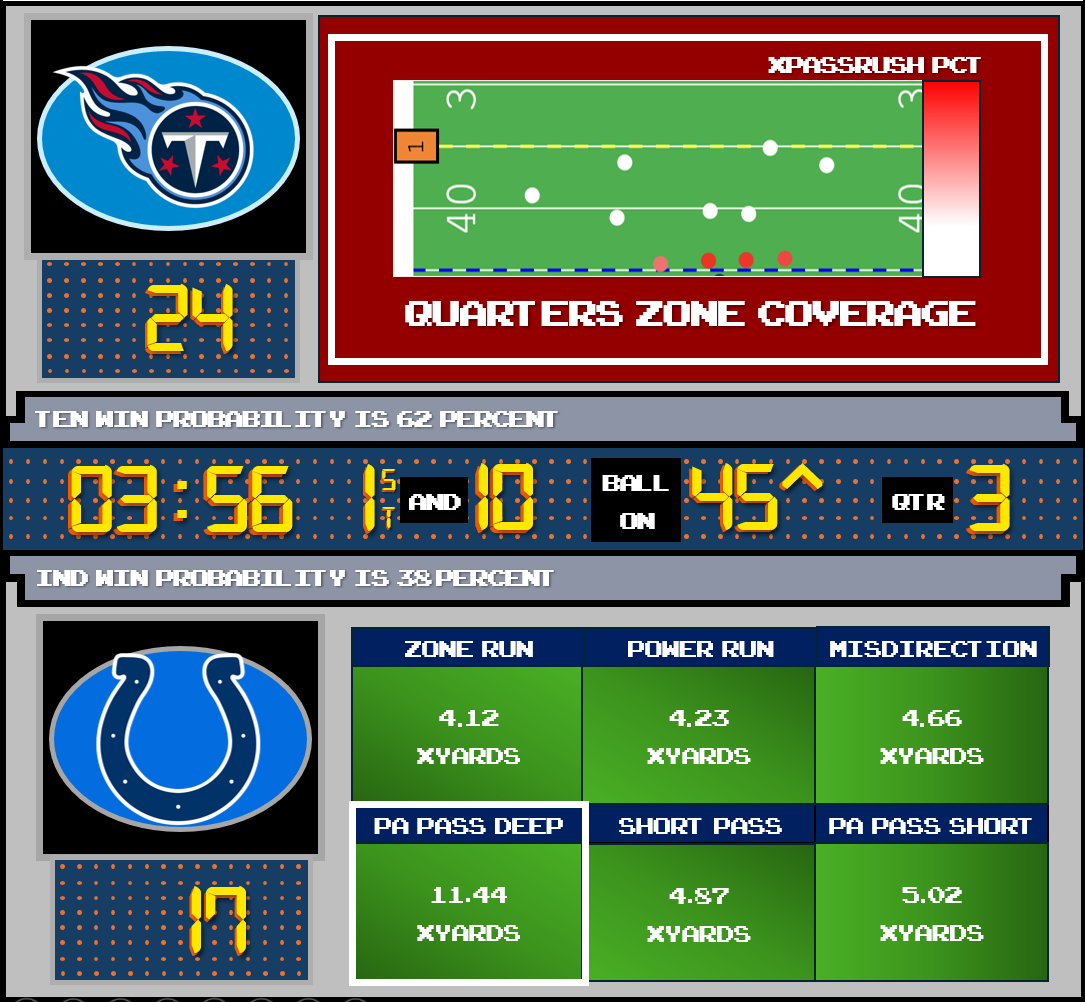
We illustrate usage of the xYards model on a sample play from Week 9 of the 2022 NFL season. With context extracted from the pre-snap data, the following prompt is generated:
It is the 3rd quarter with 03:44 left. It is 1st down with 10 yards to go. The ball is on the LAC 25 yardline. The score is ATL 17 - LAC 14. LAC have the ball. Current win probability for ATL is 0.55 and for LAC it is 0.45. The offense is in singleback formation with the receivers aligned in 2x2. The defense is in zone coverage with cover-3 formation. The defense is rushing 0 cornerbacks, 0 safeties, 0 inside linebackers, 2 outside linebackers, 0 defensive ends, and 3 interior defensive linemen. The offense's play call is a power run.
From this context, the xPassRush model predicts that the play, a power run, will result in a gain of 5.12 yards as indicated by the red marker on the field. Isaiah Spiller takes the ball and rushes for 7 yards, for which he would be credited with 2 Yards Gained over Expected (YGoE) for this play.
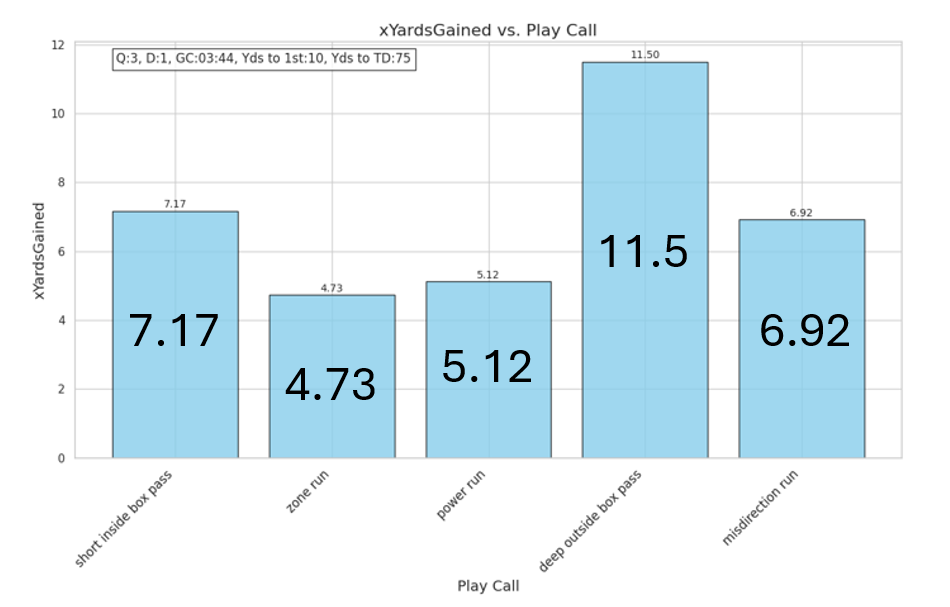
Given that same context, we can use the xYards model to generate counterfactual outcomes for the play. Figure 4 shows xYards predictions for a set of 4 plays: a short pass in the middle of the field, a run with a zone blocking scheme, a deep pass outside the numbers, and a misdirection run. For this scenario, the xYards model predicts that a deep pass outside the numbers will yield the greatest xYards, followed by a short pass over the middle.
We ran inference on every play to tabulate performance based on expected yards (xYards) and Yards Gained over Expected (YGoE) for all NFL passers.
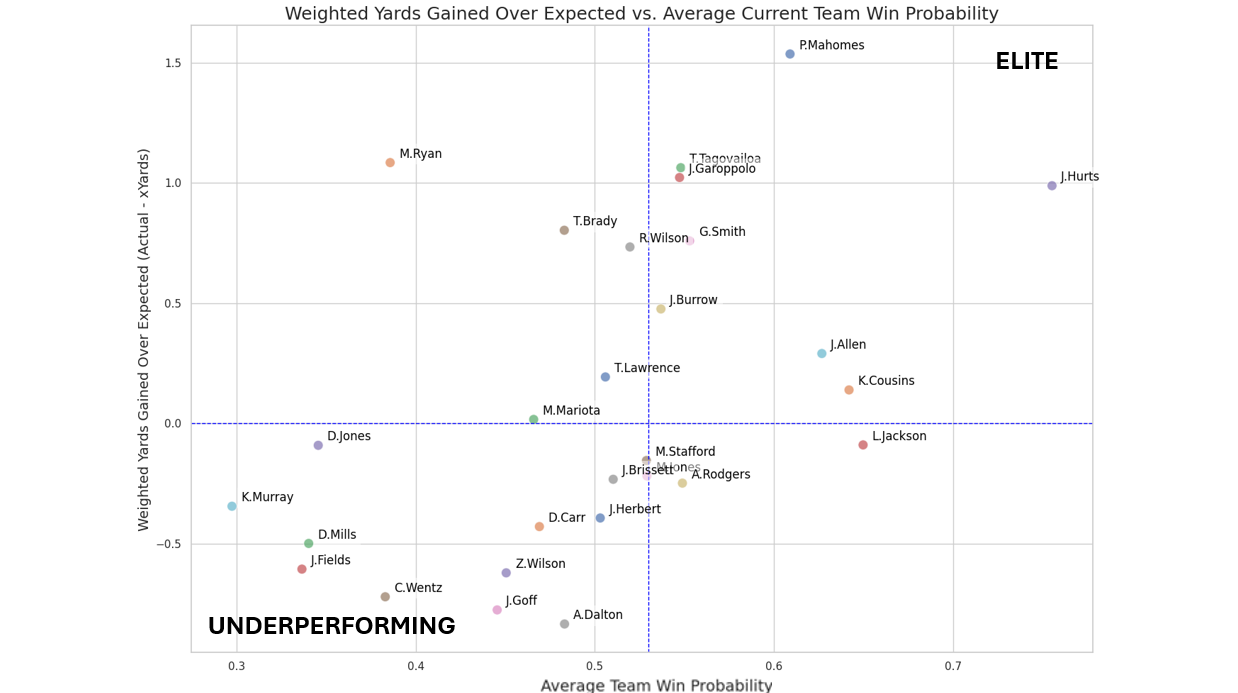
We set out to determine if YGoE correlates with winning probability for passers. Figure 5 shows the YGoE vs. the Average Team Winning Probability for all passers who registered 150 plays through Weeks 1-9 in the 2022 NFL season. Incompletions disproportionately penalize a QB's YGoE as their number of passing attempts increases, so a quadratic adjustment factor is used to normalize this effect.
Elite QB play (upper right quadrant) leads to a higher average win probability, while poor QB play (lower left quadrant) leads to a lower average win probability. In other cases, teams may have high winning percentages in spite of their passing performance (lower right quadrant) or have passing statistics that could be inflated by defensive looks that come in scenarios with low winning probabilities (top left quadrant).
In Figure 6, we plot all teams by Yards Gained over Expected (YGoE) vs. Average Team Win Probability for passing and rushing plays. To create a single comparable metric, we normalize both axes and project the data onto the line of perfect correlation in the normalized space. We then transform the projections back into the original metric space for visualization. The team's projected position along this line serves as the basis for our model's ranking.
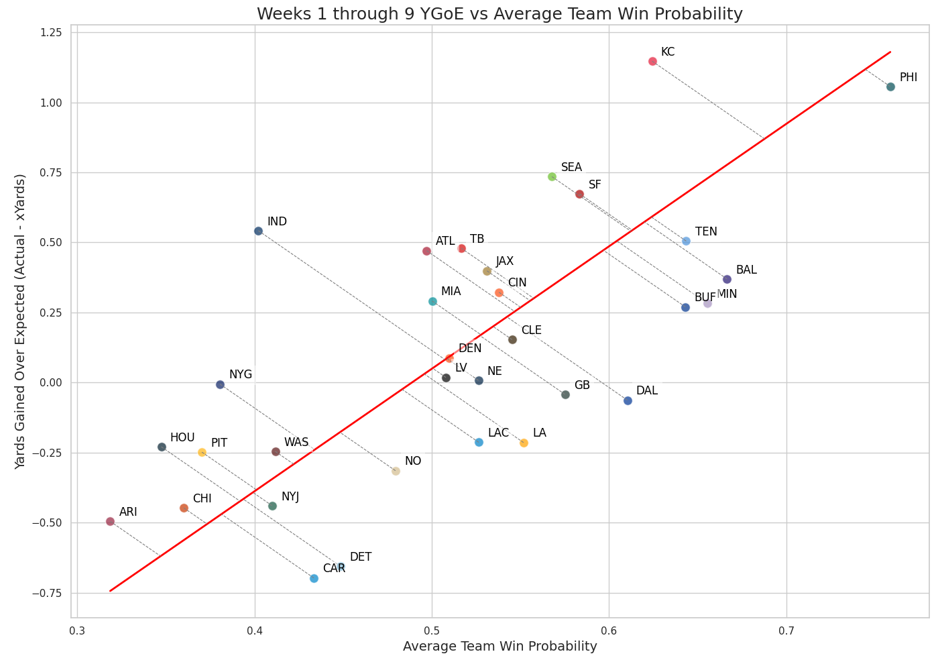
Data points lying above the line of perfect correlation represent teams that are outperforming their record, indicating that their YGoE exceeds what would typically be expected given their win probability. Conversely, teams below this line are underperforming, suggesting that their YGoE is lagging behind expectations. This approach offers an assessment of team efficiency and potential beyond mere win-loss records.
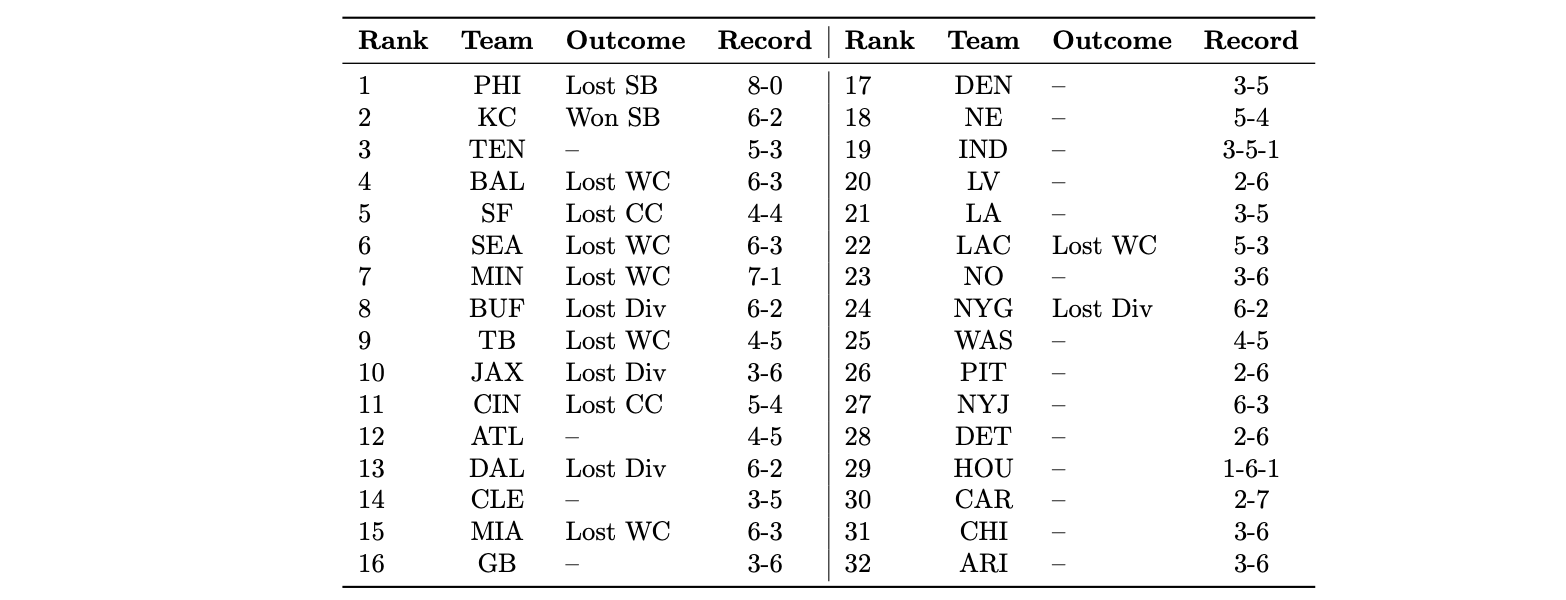
Our model demonstrated strong predictive capabilities, accurately ranking the two Super Bowl finalists as the top two teams (Philadelphia Eagles and Kansas City Chiefs). While the Minnesota Vikings held a 7-1 record, our model ranked them 7th, correctly anticipating their Wild Card exit. Similarly, the Jacksonville Jaguars, despite a 3-6 record, were ranked 10th and advanced to the Divisional Round, and San Francisco, at 4-4, was ranked 5th, aligning with their Conference Championship run. Notably, the model ranked the 6-3 New York Jets at 27th, reflecting skepticism validated by their failure to make the playoffs.
The Tennessee Titans, while in prime playoff position at Week 9, suffered a seven-game losing streak to end the year to miss out on any post-season success. The New York Giants and Los Angeles Chargers earned wild card spots despite projecting poorly according to our model, highlighting some limitations of our model in capturing the full complexity of team dynamics, situational factors, and individual performances over a season.
This study demonstrates the potential of combining natural language processing with football analytics to enhance our understanding of play outcomes and team performance. By training a regression model on top of the BERT architecture, we developed a framework to predict Expected Yards Gained (xYards) and derive Yards Gained over Expected (YGoE). These metrics offer valuable insights into play evaluation, player contributions, and team efficiency, enabling the creation of both team and passer rankings. Notably, the model's rankings closely aligned with postseason outcomes, demonstrating its predictive value in assessing team potential.
Some notable limitations of our model include the simplifying assumptions made during data preprocessing and the omission of situational complexities such as weather conditions, player injuries, and other external factors. Additionally, the model consistently outputs similar xYards predictions for all plays categorized as deep passes, regardless of contextual variations. This behavior suggests that the model may fail to capture the nuances of deep passing plays, likely due to insufficient differentiation within the training data or oversimplifications in feature engineering.
Expanding the training data to include multiple seasons or postseason data could improve the model's generalizability and support more comprehensive analysis. Additionally, similar to the development of xYards, a Win Probability Added (WPA) metric could be generated for each play. Integrating xYards with WPA would enable a more robust evaluation system, accounting for scenarios where maximizing xYards is not the optimal choice. This integration could support the development of a play-ranking system based on situational context and metrics for passers, reflecting how often their play calls align with model-determined optimal plays. Such a system could introduce a novel passer metric, Audible Efficiency, representing a passer's ability to select plays that maximize situational effectiveness.
Word Count: 1986
All code is available at this Github Repo
We would like to thank Michael Lopez, Thompson Bliss, Ally Blake, Paul Mooney, and Addison Howard for organizing the NFL Big Data Bowl 2025 and providing the dataset that made this work possible.
[1] Ferraiola, Joseph, et al. xPassRush: Identifying Pass Rushers Pre-Snap. Kaggle Notebook. Available at: https://www.kaggle.com/code/josephferraiola/xpassrush-identifying-pass-rushers-pre-snap. Accessed: January 5, 2025.
[2] Devlin, Jacob, et al. BERT: Pre-training of Deep Bidirectional Transformers for Language Understanding. arXiv preprint, arXiv:1810.04805 (2018). Available at: https://arxiv.org/abs/1810.04805.
[3] Chen, Tianqi, and Carlos Guestrin. XGBoost: A Scalable Tree Boosting System. Proceedings of the 22nd ACM SIGKDD International Conference on Knowledge Discovery and Data Mining. 2016. DOI: 10.1145/2939672.2939785.