


TSENAT is an R package for quantifying and modelling the relative isoform-usage diversity across samples. It provides a complementary, orthogonal analytical method to standard differential-expression tools (for example, DESeq2), allowing the identification of isoform switching and splicing-driven regulatory changes that may occur without pronounced changes in overall gene expression, enabling thus the detection of regulatory events which cannot be captured by count-based differential expression methods.
Key capabilities:
- Scale-dependent diversity analysis: evaluate isoform heterogeneity at different sensitivity levels using the parameter
q. - Statistical testing: compare diversity measures between sample groups using Wilcoxon tests, permutation-based and linear-model approaches.
- Reproducible workflows: from raw counts to publication-ready visualizations with paired sample support.
Tsallis entropy generalizes Shannon entropy. For a probability vector
When
Most genes produce multiple protein isoforms through alternative splicing. Rather than treating gene expression as a single number, TSENAT captures the pattern of isoform usage—which isoforms are abundant vs. rare—by computing Tsallis entropy at the transcript level.
The parameter q acts as a sensitivity dial for isoform weighting:
-
$q < 1$ (e.g., 0.1, 0.5): emphasizes rare isoforms—useful for detecting whether a gene maintains diverse isoforms or loses minor variants in disease. -
$q \approx 1$ (Shannon entropy): balanced view of overall isoform diversity. -
$q > 1$ (e.g., 1.5, 2): emphasizes dominant isoforms—useful for detecting when one isoform abnormally dominates (common in cancer).
-
calculate_tsallis_entropy(): calculate Tsallis entropy for a single isoform distribution. -
calculate_diversity(): calculate diversity for every gene in your dataset. Works with count matrices, tximport lists, or standard Bioconductor objects. -
calculate_difference(): test whether diversity changes between groups (e.g., tumor vs. normal). Supports paired samples and multiple statistical tests. -
calculate_lm_interaction(): fit linear models to test interactions between factors (e.g., does treatment effect on diversity depend on genotype?). Useful for complex experimental designs.
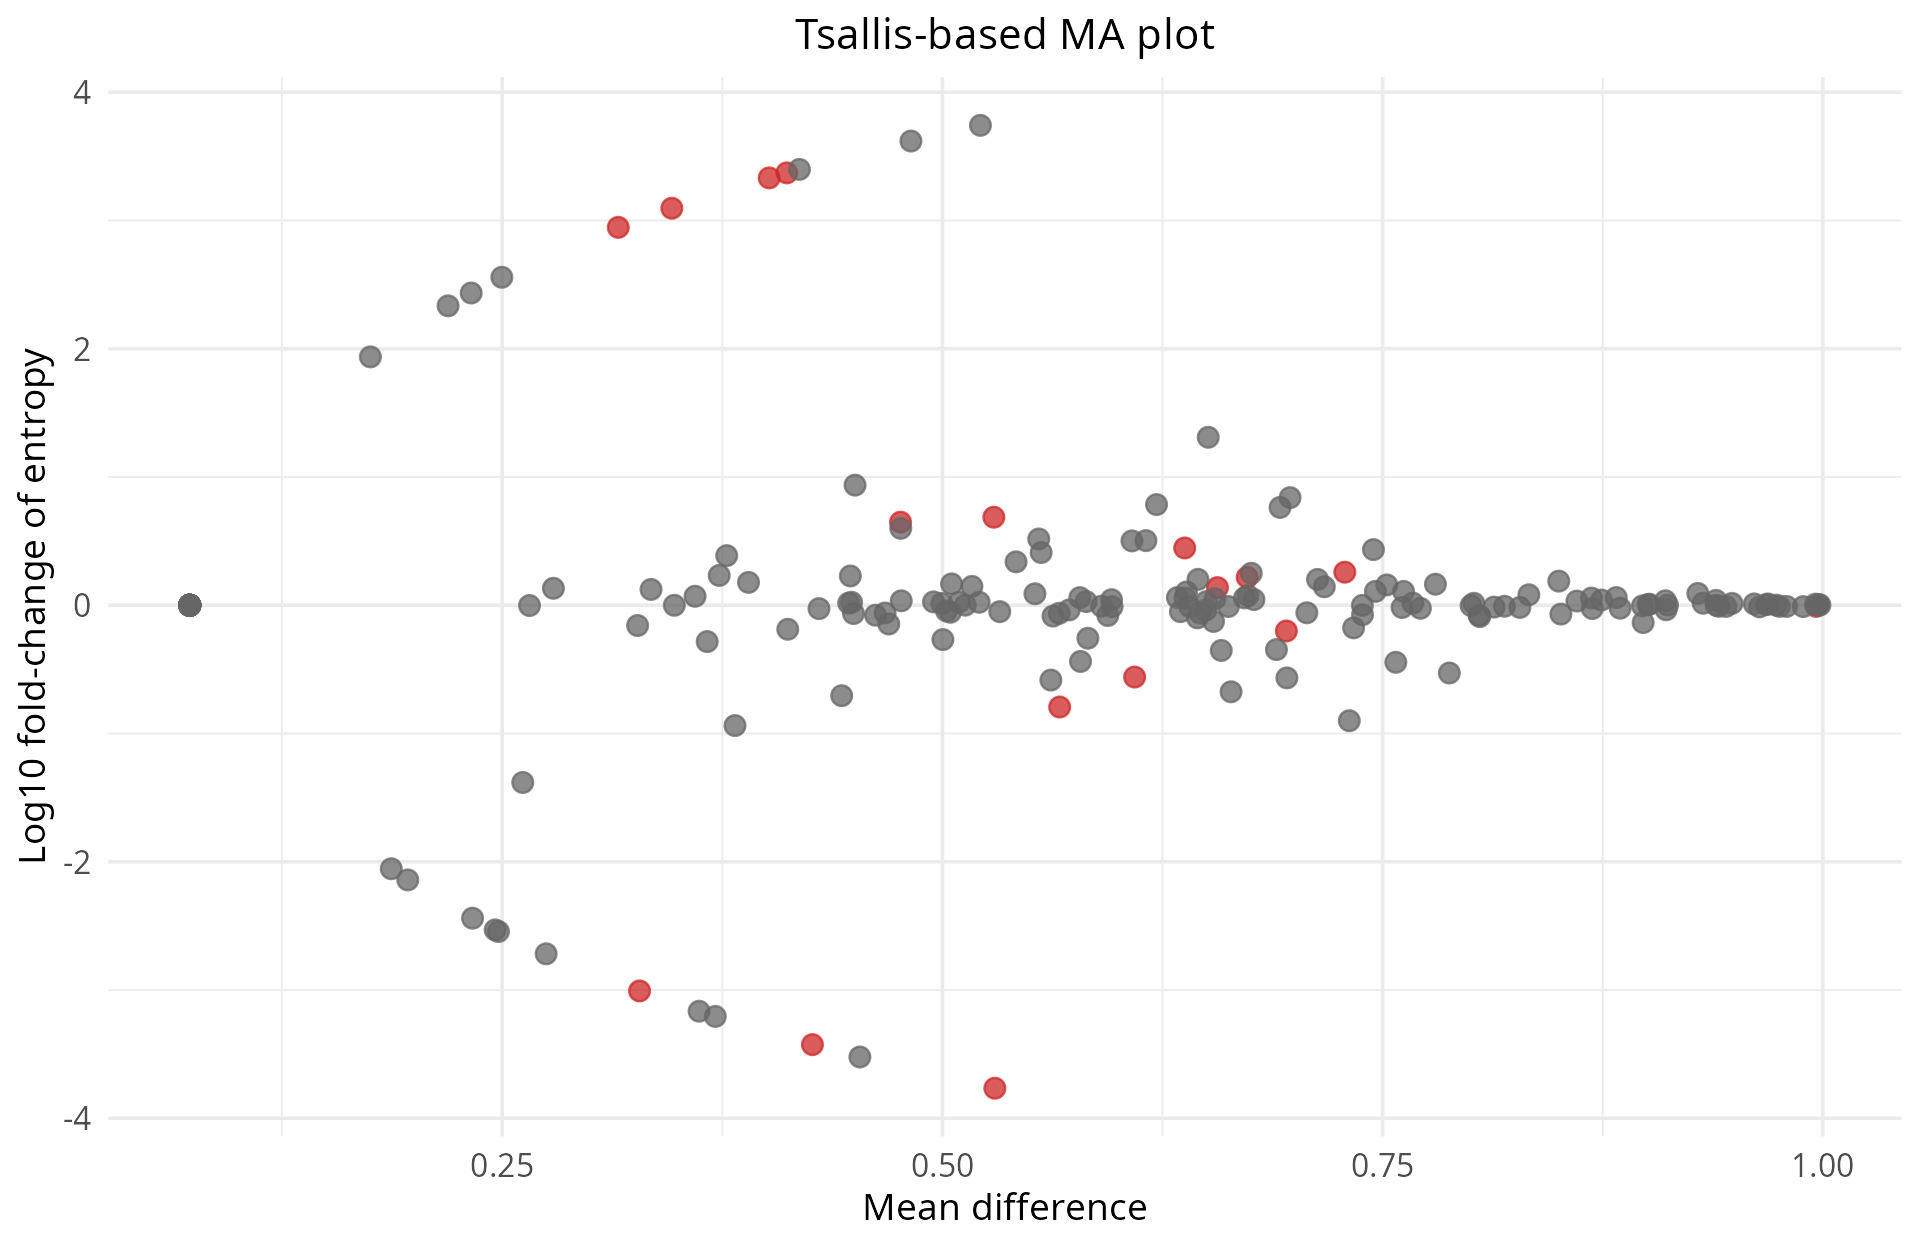
Beyond computing diversity values, TSENAT enables group comparisons to identify biological effects:
- Paired and unpaired designs: test whether isoform diversity differs between groups (e.g., tumor vs. normal samples). Account for paired designs when comparing same patients before/after treatment, or use unpaired designs for independent cohorts.
- Robust statistical testing: choose between Wilcoxon rank-sum tests (ideal for small sample sizes and non-normal distributions common in omics data) or permutation-based tests (no distributional assumptions required).
- Linear model framework: fit linear mixed-effects models to account for random effects and covariates, which are particularly useful when controlling for confounding variables while testing group effects on diversity.
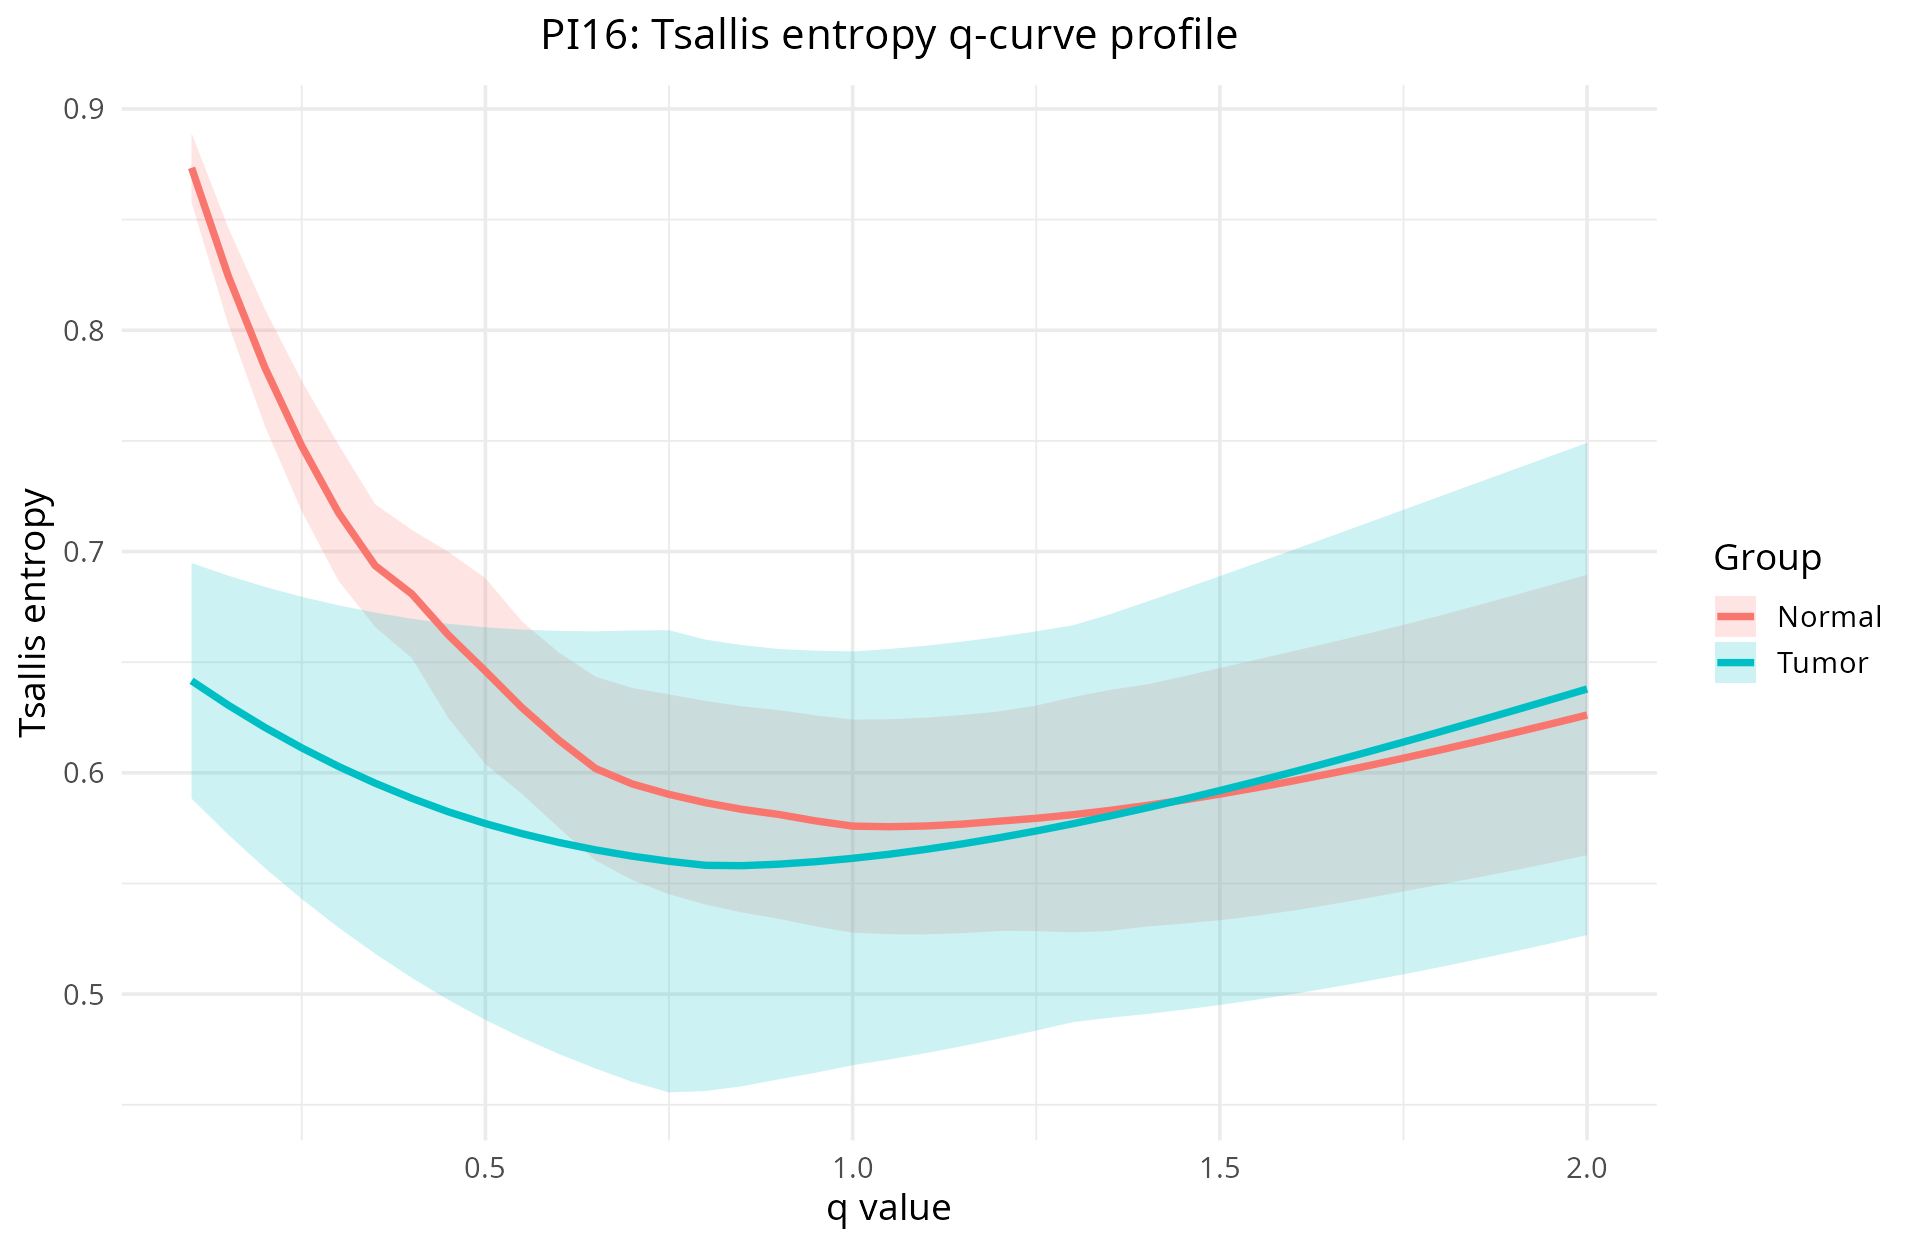
- Per-gene q-curve profiles: visualize how a single gene's isoform diversity changes across the sensitivity parameter
q. This reveals scale-dependent patterns: rare isoforms may disappear at highq, while dominant isoforms emerge.
- Group comparisons and significance: summarize diversity differences between biological groups across all genes simultaneously to identify candidate genes.
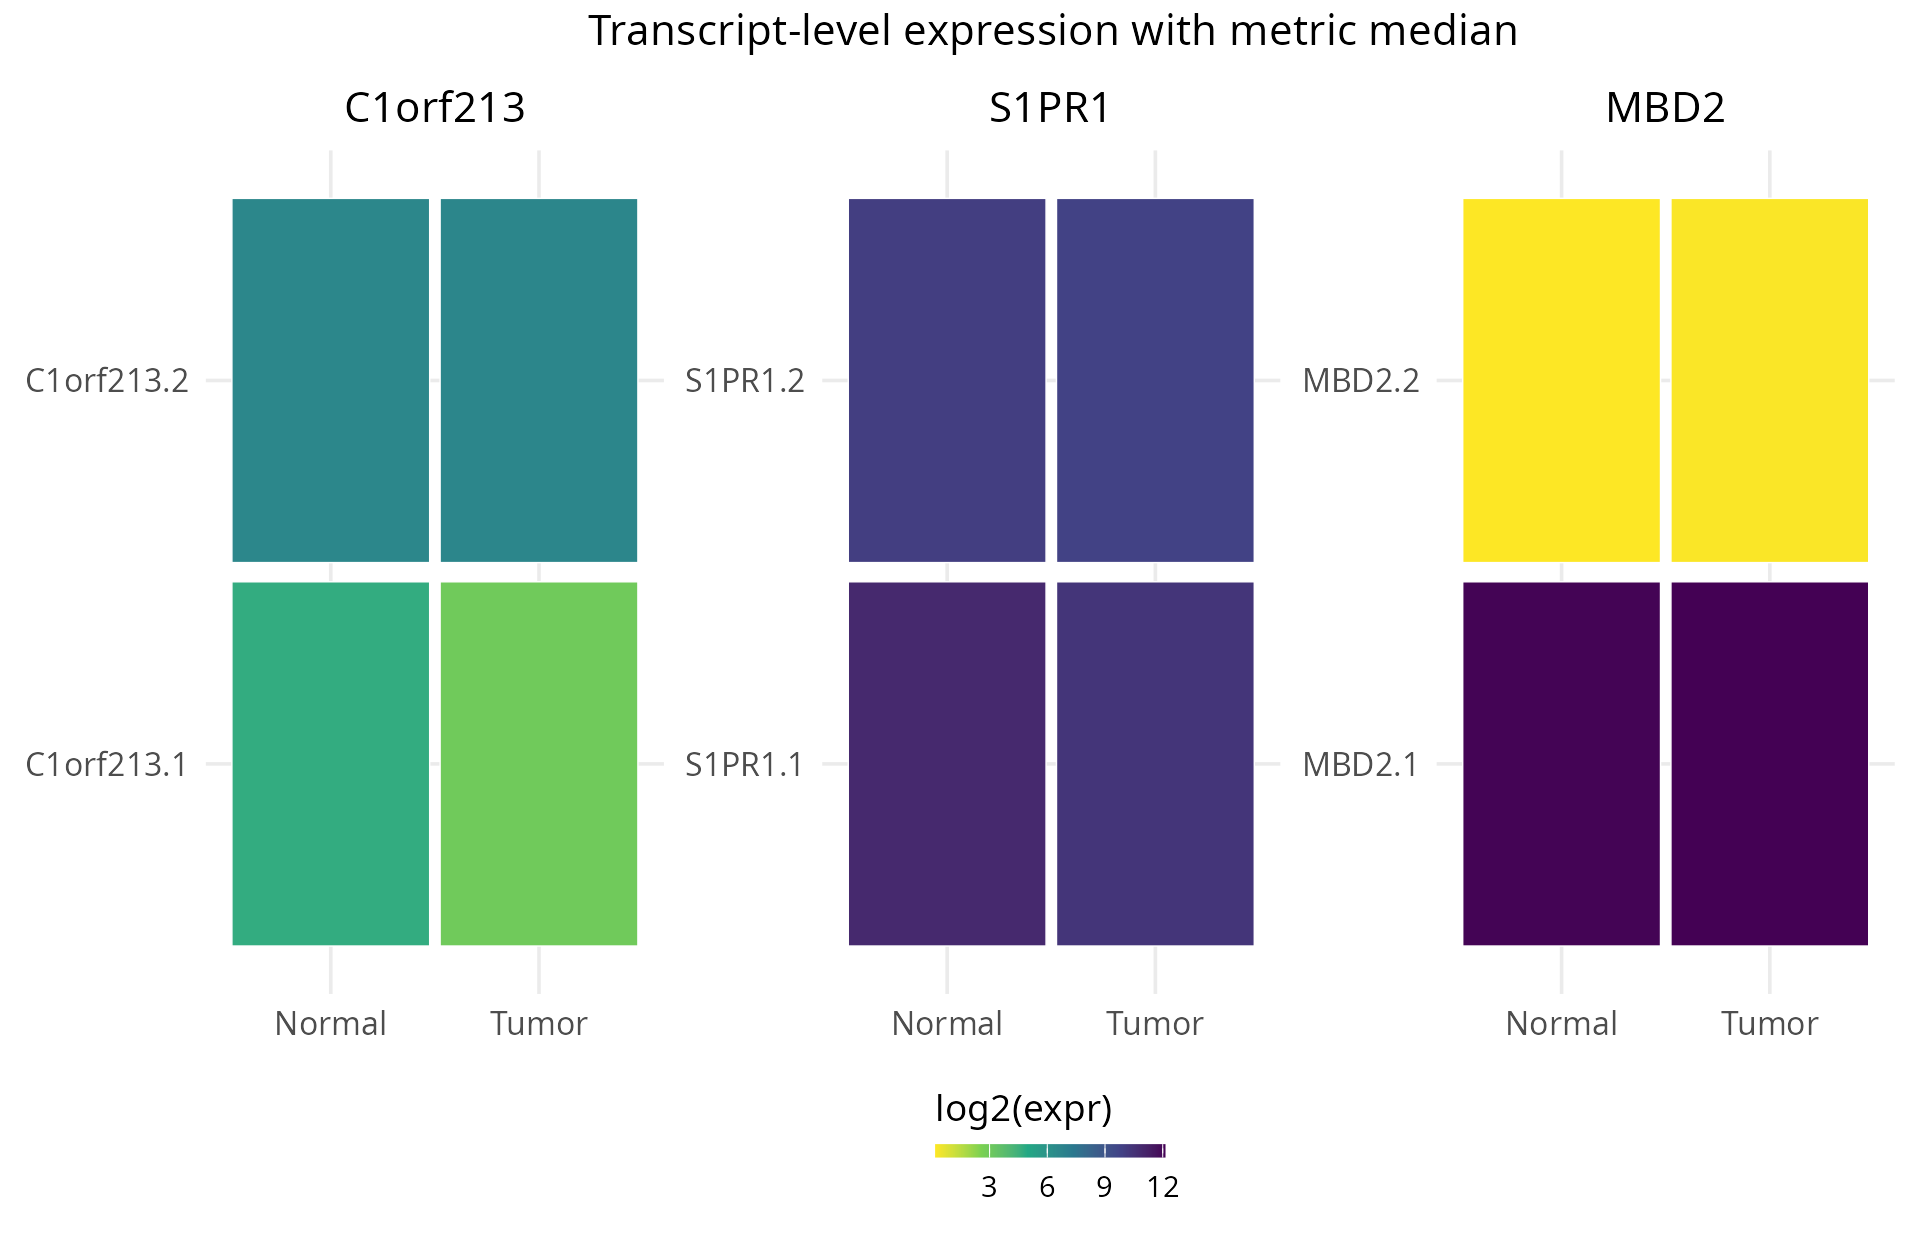
- Isoform-level details: explore individual transcripts to understand which specific isoforms are driving diversity changes. TSENAT enables the visualization of transcript composition across samples for candidate genes.
Install from GitHub:
if (!requireNamespace("remotes", quietly = TRUE)) install.packages("remotes")
remotes::install_github("gallardoalba/TSENAT")

## Recommended (reproducible environment): use renv
install.packages("renv")
renv::init()
renv::snapshot()Compute Tsallis diversity for a single q and plot a q-curve across multiple q values:
library(TSENAT)
data("tcga_brca_luma", package = "TSENAT")

# Compute normalized diversity for q = 0.1
readcounts <- as.matrix(tcga_brca_luma[, -1, drop = FALSE])
genes <- tcga_brca_luma[, 1]
ts_se <- calculate_diversity(readcounts, genes, q = 0.1, norm = TRUE)

# Compute across multiple q values
qvec <- seq(0.01, 2, by = 0.1)
ts_multi <- calculate_diversity(readcounts, genes, q = qvec, norm = TRUE)

# Visualize
p_qcurve <- plot_tsallis_q_curve(ts_multi)
print(p_qcurve)
For a detailed, reproducible workflow see the package vignette.
Testing is vital in research as it ensures the validity and reliability of results, which is essential for accurately interpreting findings. The report about the current testing coverage can be found in here.
If you use TSENAT in your research, please cite:
citation("TSENAT")This command displays the recommended bibliographic entry. A machine-readable CITATION file is included with the package for easy export to reference managers.
BibTeX entry:
@software{gallardo2026tsenat,
  title={TSENAT: Tsallis Entropy Analysis Toolbox},
  author={Gallardo Alba, Cristóbal},
  url={https://github.com/gallardoalba/TSENAT},
  year={2026}
}We welcome contributions! Please follow these guidelines:
- Fork the repository
- Create a feature branch (
git checkout -b feature/your-feature-name) - Make your changes and test locally with
R CMD check - Commit with clear messages (
git commit -m 'Add feature: description') - Push to your fork (
git push origin feature/your-feature-name) - Open a Pull Request describing your changes
Ensure all checks pass before submitting:
devtools::check()
devtools::test()Continuous integration is configured with CircleCI to install all suggested packages for comprehensive testing. To reproduce a CI-like environment locally:
# Install all suggested dependencies
remotes::install_deps(dependencies = c("Suggests"))

# Run checks
R CMD check --as-cranThis project is licensed under the GNU General Public License v3.0 (GPL-3). See LICENSE for details.
Attribution: TSENAT builds upon the SplicingFactory package, extending it with specialized focus on Tsallis entropy analysis.
“If I ever come back from the past, it's to create a cyclone.”
— Juan José Lozano