
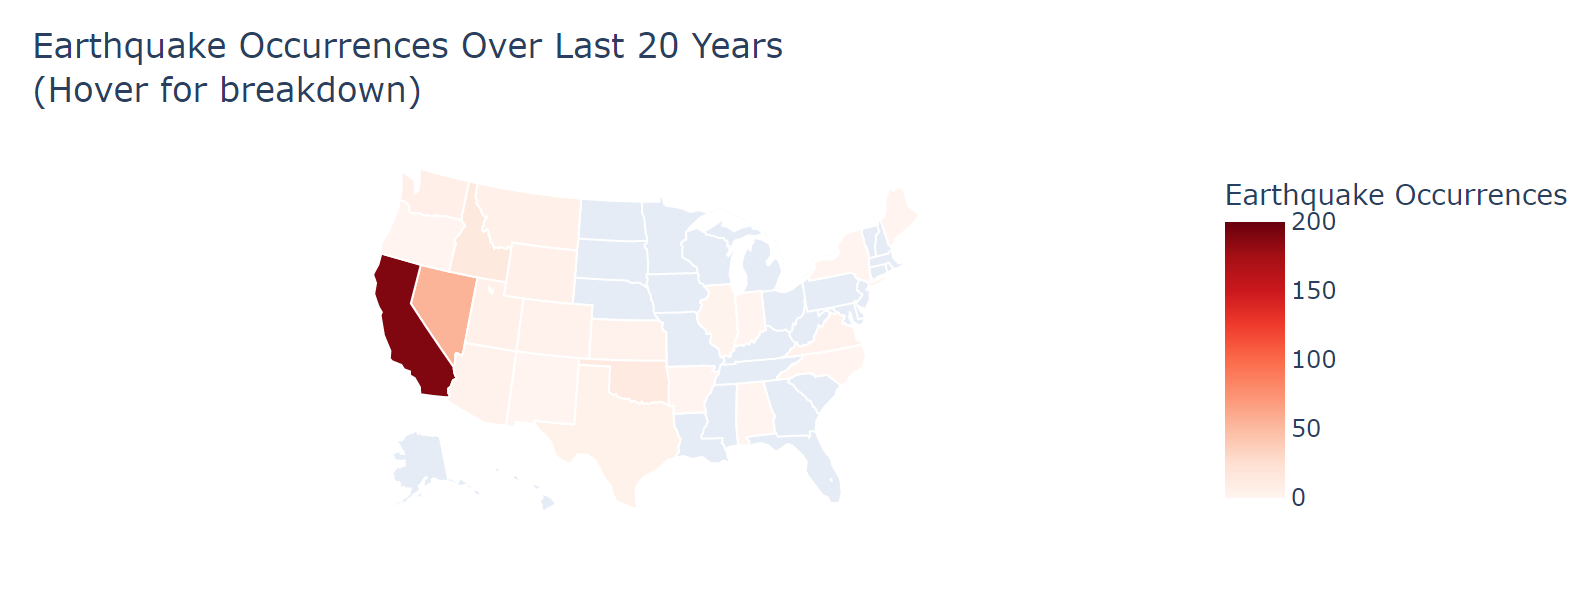

This tool uses plotly to create choropleth maps displaying the average earthquake magnitude and amount of earthquake deaths through the years 2000 - 2021 in the United States. By hovering over a specific state, the user can view the magnitude/deaths as a number.
Data was gathered from the United States Geological Survey. By inputting a range for location and time, it generated a CSV file containing info of all Earthquakes in a specific region.
https://earthquake.usgs.gov/earthquakes/search/
Within the CSV file, the geom coordinates for the earthquake was used to identify the state using Geopy.
Using this data, a choropleth map of the amount of earthquake occurrences per state was created, and a choropleth of the average earthquake magnitude per state was also created.
Rohan Sazad is a student at CUNY Queens College majoring in Computer Science. He has knowledge in C++ and Python.
Email: rsazad813@gmail.com
LinkedIn: https://www.linkedin.com/in/rohan-sazad-635293217/