
This repo contains the source code for the work StoryPoint: A Data Story Authoring Tool for Domain Experts.
In today’s data-driven world, enterprises face the dual challenge of deriving value from vast datasets and effectively communicating insights. While data storytelling is integral for conveying insights, existing authoring tools often fail to fully integrate domain expertise or support the entire storytelling process. This paper introduces StoryPoint, an open-source data story authoring tool that combines domain expertise with Generative AI to dynamically enhance data story creation. By enabling domain experts to intuitively visualize data through natural language inputs alongside pre-calculated charts and narratives, we found the gap between visualization and interpretation can be narrowed. To design StoryPoint, we followed a literature-grounded and user-centered design approach. A formative evaluation with eight domain experts reveals StoryPoint’s efficacy in rapid data story prototyping. A summative evaluation, including (i) a small-scale experiment comparing StoryPoint with a benchmark, (ii) a large-scale online experiment with 104 crowdworkers, and (iii) three real-world industry cases, underscores its utility. StoryPoint is open source and can be accessed on GitHub.
The code uses python 3.9.13 and Streamlit 1.23.1. The full dependency can be found and installed via requirements.txt.
After that, follow the installation from this Readme and navigate to the frontend directory to initialize npm and subsequently install the node modules.
A running live demo can be found here. Due to the deployment process there might be two problems that don't occur when running the porject localy:
- problem with MultiVision package: we noticed that unconventional graphical representations may be generated
- problem with the API quota: Because the app is now public, we limited the API quota to 10$ per month. If the quota is exceeded, the LLM functions won't work anymore.
.
├── data # csv files of the provided sample datasets
├── feedback # json files containing user feedback collected by the feedback button
├── feedback_component # the implementation for the feedback button component
├── frontend # contains the [Streamlit Image Carousel](https://github.com/DenizD/Streamlit-Image-Carousel)
├── multivision # Automatically generated Charts from the [MultiVision Paper](https://github.com/wowjyu/MultiVision)
├── pages # The content of the app containing the streamlit web pages
│ ├── 00_exploratory_data_analysis.py # Data Exploration
│ ├── 01_layout_creation.py # Story Composition
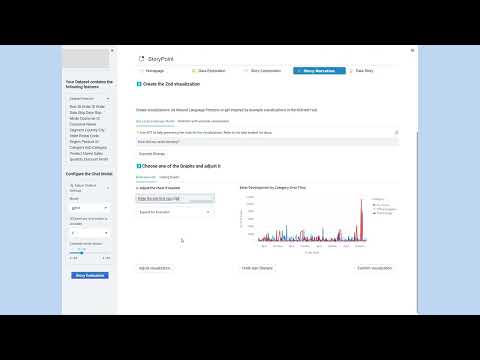
│ ├── 02_create_visualizations.py # Story Narration
│ ├── 03_data_story_1.py # Final Data Story (dynamically generated inside of helper_functions.py)
├── homepage.py # Homepage that explains how the tool works
├── README.md
├── requirements.txt
Fill in youre OpenAI API key in the .streamlit/secrets.toml file.
Navigate into the root folder of the app and inside the terminal type streamlit run .\homepage.py. Now the app should open up in your localhost.
The app guides you through the creation of a data story and offers the following features:
- Choose your Dataset
- Perform an Exploratory Data Analysis (EDA) to become familiar with the data and to get inspired for possible visualizations
- Choose the data story layout
- Create the visualizations using a no code NL2VIS Interface with OpenAIs Large Language Models (LLM)
- Adjust the visualizations until they suit you
- Get inspired by the automatically generated narrative elements that will correspond to the respective visualizations
- View and Explore your finished data story with interactive filters, the AskData feature and the option for the viewer to provide Feedback
Sarah, a newly onboarded consultant at a boutique consulting firm, receives sales data from the client’s Chief Sales Officer and is tasked to create an initial report, containing the first important insights regarding sales until end of day. However, Sarah acknowledges her limited proficiency in data visualization techniques and utilizes StoryPoint to visualize the data. For analysis, she uploads her data and StoryPoint automatically generates an exploratory data analysis report. She goes through the report and uncovers key insights of her dataset, such as how various columns are distributed and correlated. At the end of the analysis phase, Sarah is prompted to input additional contextual information, such as the intended purpose of the story or specific visualizations she wants to include. For example, she specifies that the data story should focus on identifying top-performing product categories. These inputs are integrated into StoryPoint’s LLMs, ensuring that the charts and narratives align closely with Sarah’s analytical objectives and storytelling requirements. In the planning stage, she relies on these insights to create the first page of the data story. For that, she chose one of the page layouts that are provided by StoryPoint (DP3). If none of the page layouts fit her page, she could create a custom page layout. Sarah’s chosen layout accommodates two charts, vertically arranged, accompanied by narrative elements on the right-hand side. Next, in the implementation phase, StoryPoint guides her through the creation of the charts and narrative elements of the first page. For chart creation, the tool offers two distinct modes (DP2): (1) natural language input, where she can articulate her requirements conversationally, or (2) example visualizations that serve as a springboard for her creativity (see Figure 3). Sarah’s creative process unfolds as she selects the second option for her first chart. She peruses a curated list of example visualizations and chooses one that vividly illustrates the total sales amount over time. Next, she refines the chart’s appearance using the natural language input × Add the dimension category to the chart and give each category a different color. After careful inspection and iterative refinements, she achieves the desired result—an interconnected line chart that resonates with her analytical intentions. StoryPoint also equips her with various explanatory options for the chart (DP4). She opts for the description: This chart portrays the annual sales figures for three distinct categories: furniture, office supplies, and technology, spanning the years 2014 to 2017. She augments the text with insights garnered during her exploration phase, adding a paragraph about the trends she observed in these categories from the exploratory data analysis report. Then she continues with the second chart. Her simple prompt, × Show the top 10 best-selling products per category as a bar chart swiftly produces a chart that aligns with her expectations (DP3). She opts for StoryPoint’s pre-generated narratives (DP4). To enhance the narrative’s impact, she inserts a dynamic variable calculating the revenue, allowing for automatic updates. After creating both charts and descriptions, StoryPoint automatically creates potential story purposes (DP4) that capture the content of the page. She selects the one that encapsulates her analytical objectives: Analyzing Best Sellers and Sales Evolution: Insights from Top 10 Products and Category Performance over Time. While the option to expand her narrative with additional pages exists, Sarah defers that decision for later. She concludes her work by saving the crafted data story and sending a link to her client. When accessing the data story (communication phase), the client is presented with the opportunity to engage with the data through two distinct avenues: either by perusing the data story narrative or by utilizing StoryPoint’s Ask Data feature to pose natural language questions (DP5). Additionally, the client can opt to provide direct feedback to specific elements within the data story by simply clicking on them. This action triggers the appearance of a menu within the sidebar, offering the client the ability to assess the element using a star rating system or to furnish feedback in written form (DP6).

Analysis Requirements
R1: Visualize data and statistics that allow the user to determine the quality of the data including the relationships between variables and trends.
R2: Display accessible data previews and summaries.
R3: Provide options to upload data or connect directly to enterprise infrastructure.
R4: Propose data cleaning steps with treatment options for missing or anomalous values.
R5: Extract contextual knowledge and metadata from the data.
R6: Allow users to input the story purpose and initial context as a foundation for the storytelling process
Planning Requirements
R7: Provide customizable templates for various story structures and use cases.
R8: Support multi-page story creation with logical progression recommendations.
R9: Suggest alternative layouts and visual styles based on data, context, and user goals.
R10: Offer pre-set themes for branding and domain-specific needs.
Implementation Requirements:
R11: Recommend suitable charts, narrative elements, and structural guidance.
R12: Enable visualization adjustments (e.g., titles, colors, structure) through natural language inputs.
R13: Support dynamic integration of KPIs and calculations into the narrative.
R14: Provide options to emphasize key insights in narratives using design elements (e.g., colors, fonts).
R15: Adapt narrative content dynamically based on contextual information from the dataset and user goals including audience-targeted phrasing for clarity and impact.
R16: Automatically generate an page purpose that connects charts and narratives cohesively, allowing refinement.
Communication Requirements
R17: Enable dynamic filtering of data and story elements for different audience types
R18: Include options for exporting data stories.
R19: Support interactive querying (e.g., AskData) for on-demand insights during presentations.
R20: Allow audience feedback directly on individual story elements, facilitating easy integration.
R21: Track revisions and maintain a detailed history log for iterative improvement.
This is a list of features that are currently disabled because they don't consistently achieve the desired results.
- Uploading and Using own data
- Creating Custom Layout
- Fixing the Data Upload
- Including a Preprocessing Page for own data
- Fixing the Custom Layout Creation
- Make Story Shareable in different formats (i.e. PowerPoint, png, StoryPoint Server)