Welcome to the rnaseqExplorer. This software is designed to help users easily upload and analyze RNA sequencing data. The application provides a user-friendly interface that allows you to visualize your data through various plots and explore the results in an intuitive way.
rnaseqExplorer provides functionalities for data analysis, including filtering, normalization, and understanding gene expression through visualizations like:
- 🎻 Violin plots
- 🗺️ Heatmaps
- 📈 PCA
- 🔍 Gene annotation
With its dynamic, interactive design, rnaseqExplorer is an essential tool for RNA-seq dataset analysis. It empowers bench biologists to conduct exploratory data analysis with ease, while delivering in-depth insights for seasoned data analysts. 💡
To use this application, clone the repository and follow the setup instructions in the documentation.
You can install the package using the following command:
devtools::install_github("jeongahblairlee/rnaseqExplorer")
library(rnaseqExplorer)
launchApp()
If you want to try the example data:
devtools::install_github("jeongahblairlee/rnaseqExplorer")
library(rnaseqExplorer)

if (!require("BiocManager", quietly = TRUE))
  install.packages("BiocManager")

BiocManager::install("airway")
library(airway)
launchApp()You can also access the application via the web interface:
https://jeongahblairlee.shinyapps.io/rnaseqExplorer/ (currently sever is down)
Warning: In case the dataset is large, I recommend using R due to limitations from the web server.
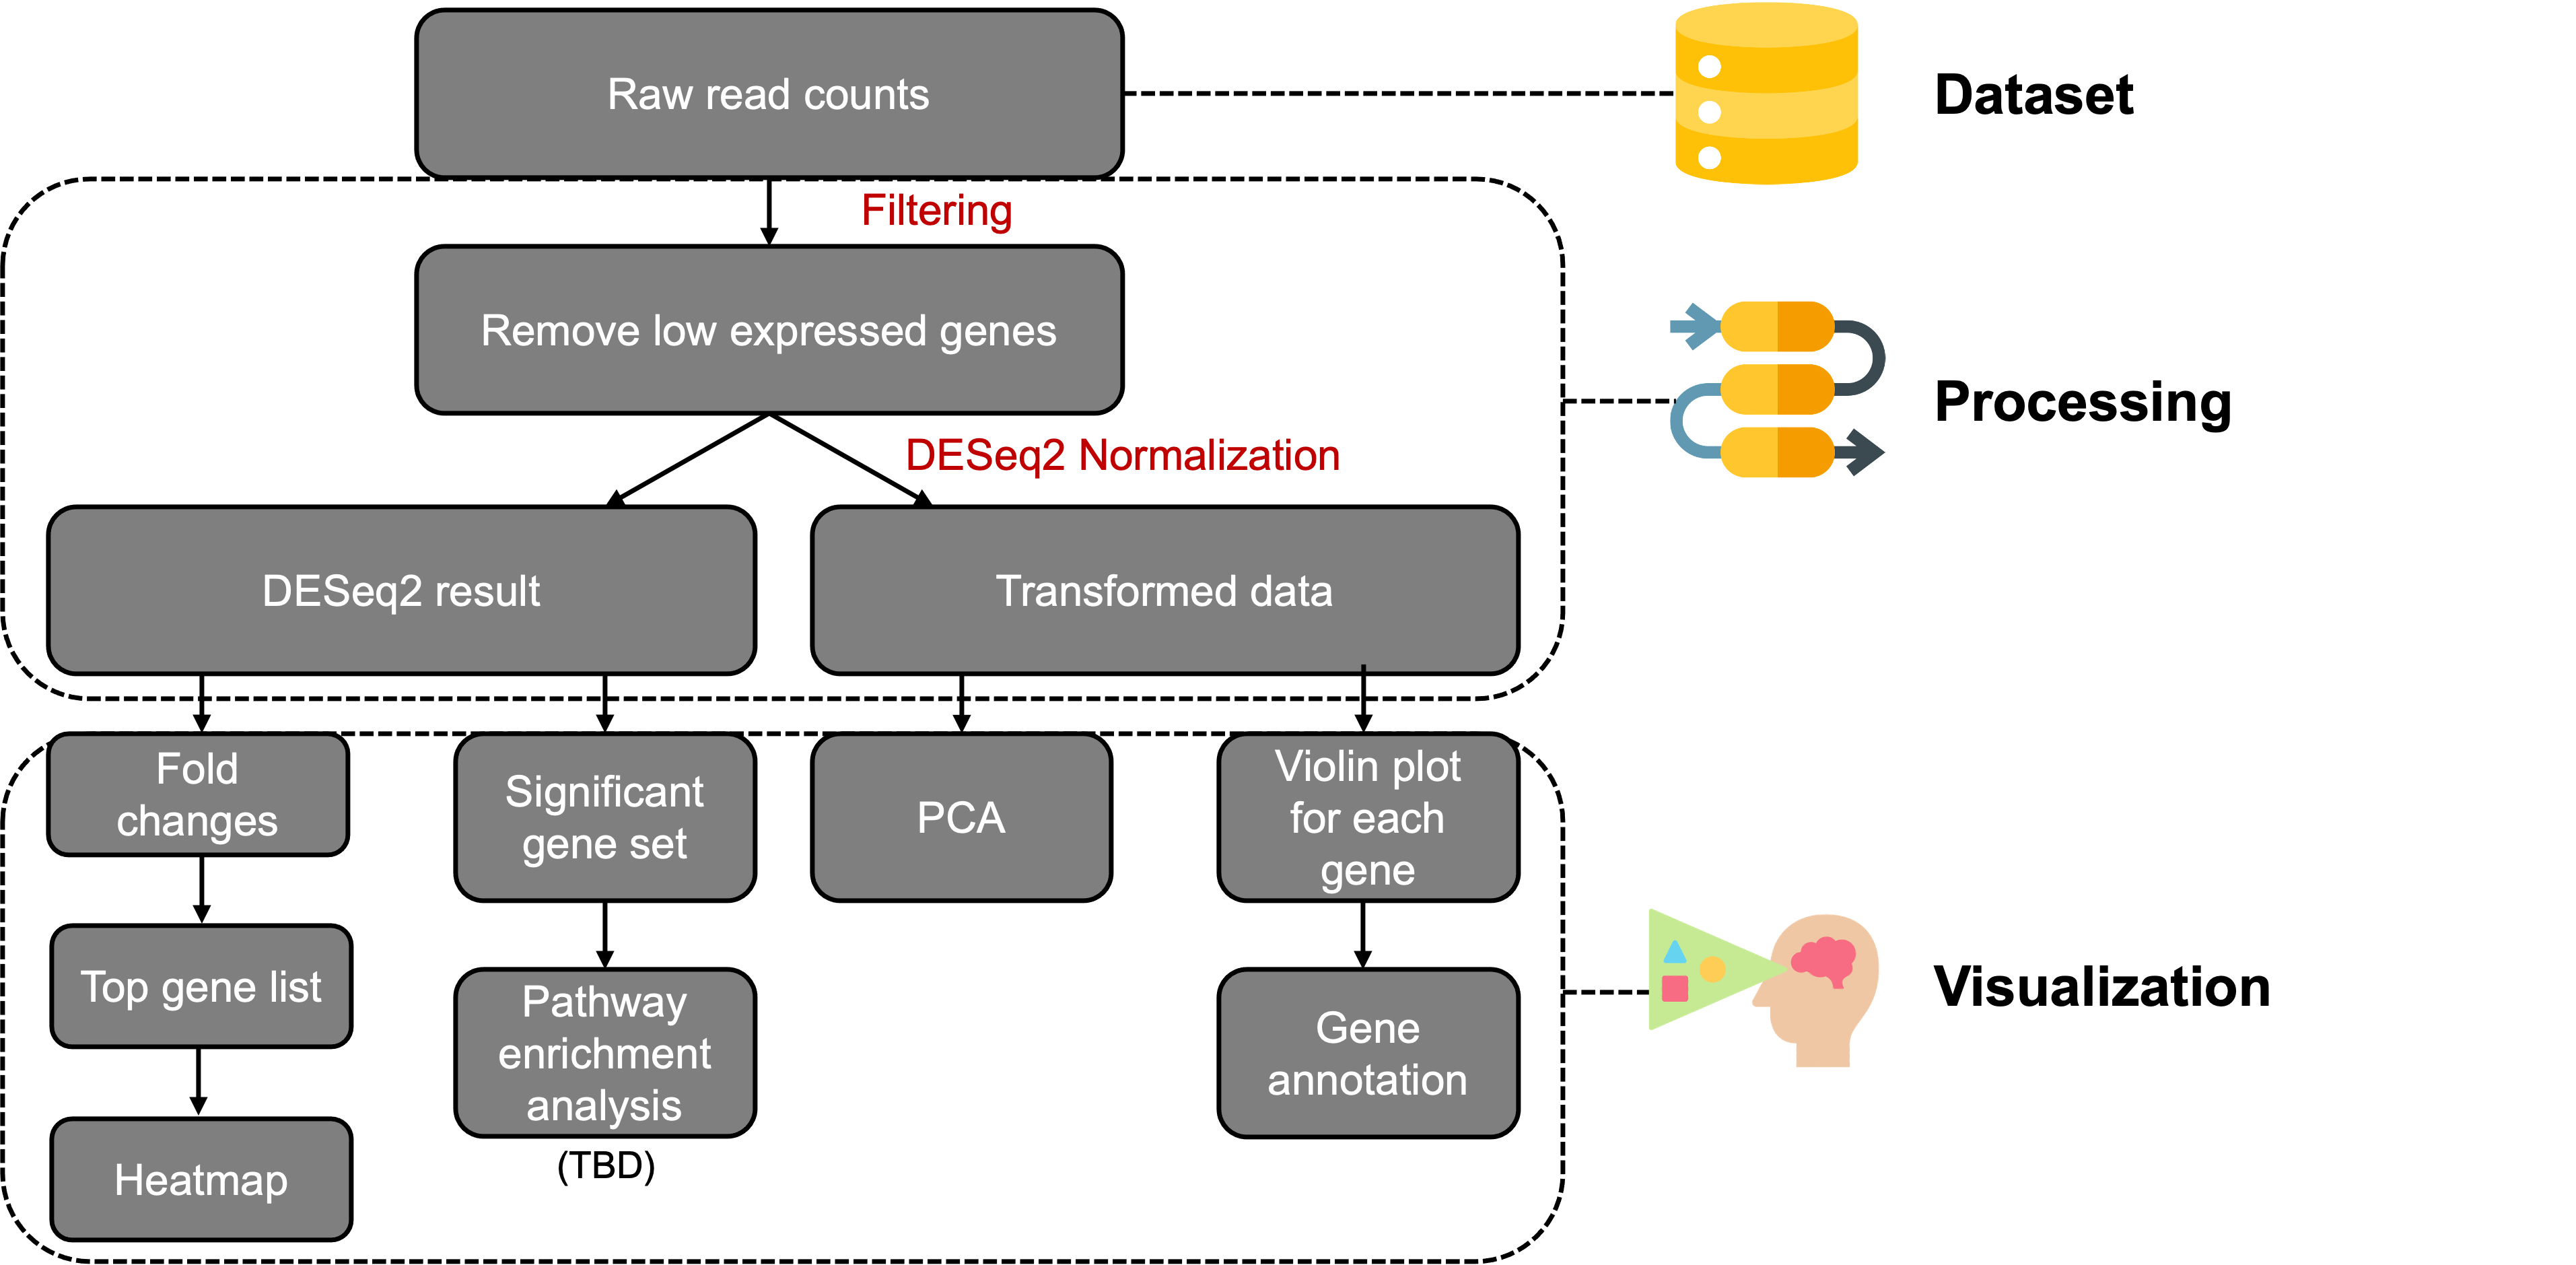
In the Workflow, you can see the overall workflow of the RNAseq Explorer application:
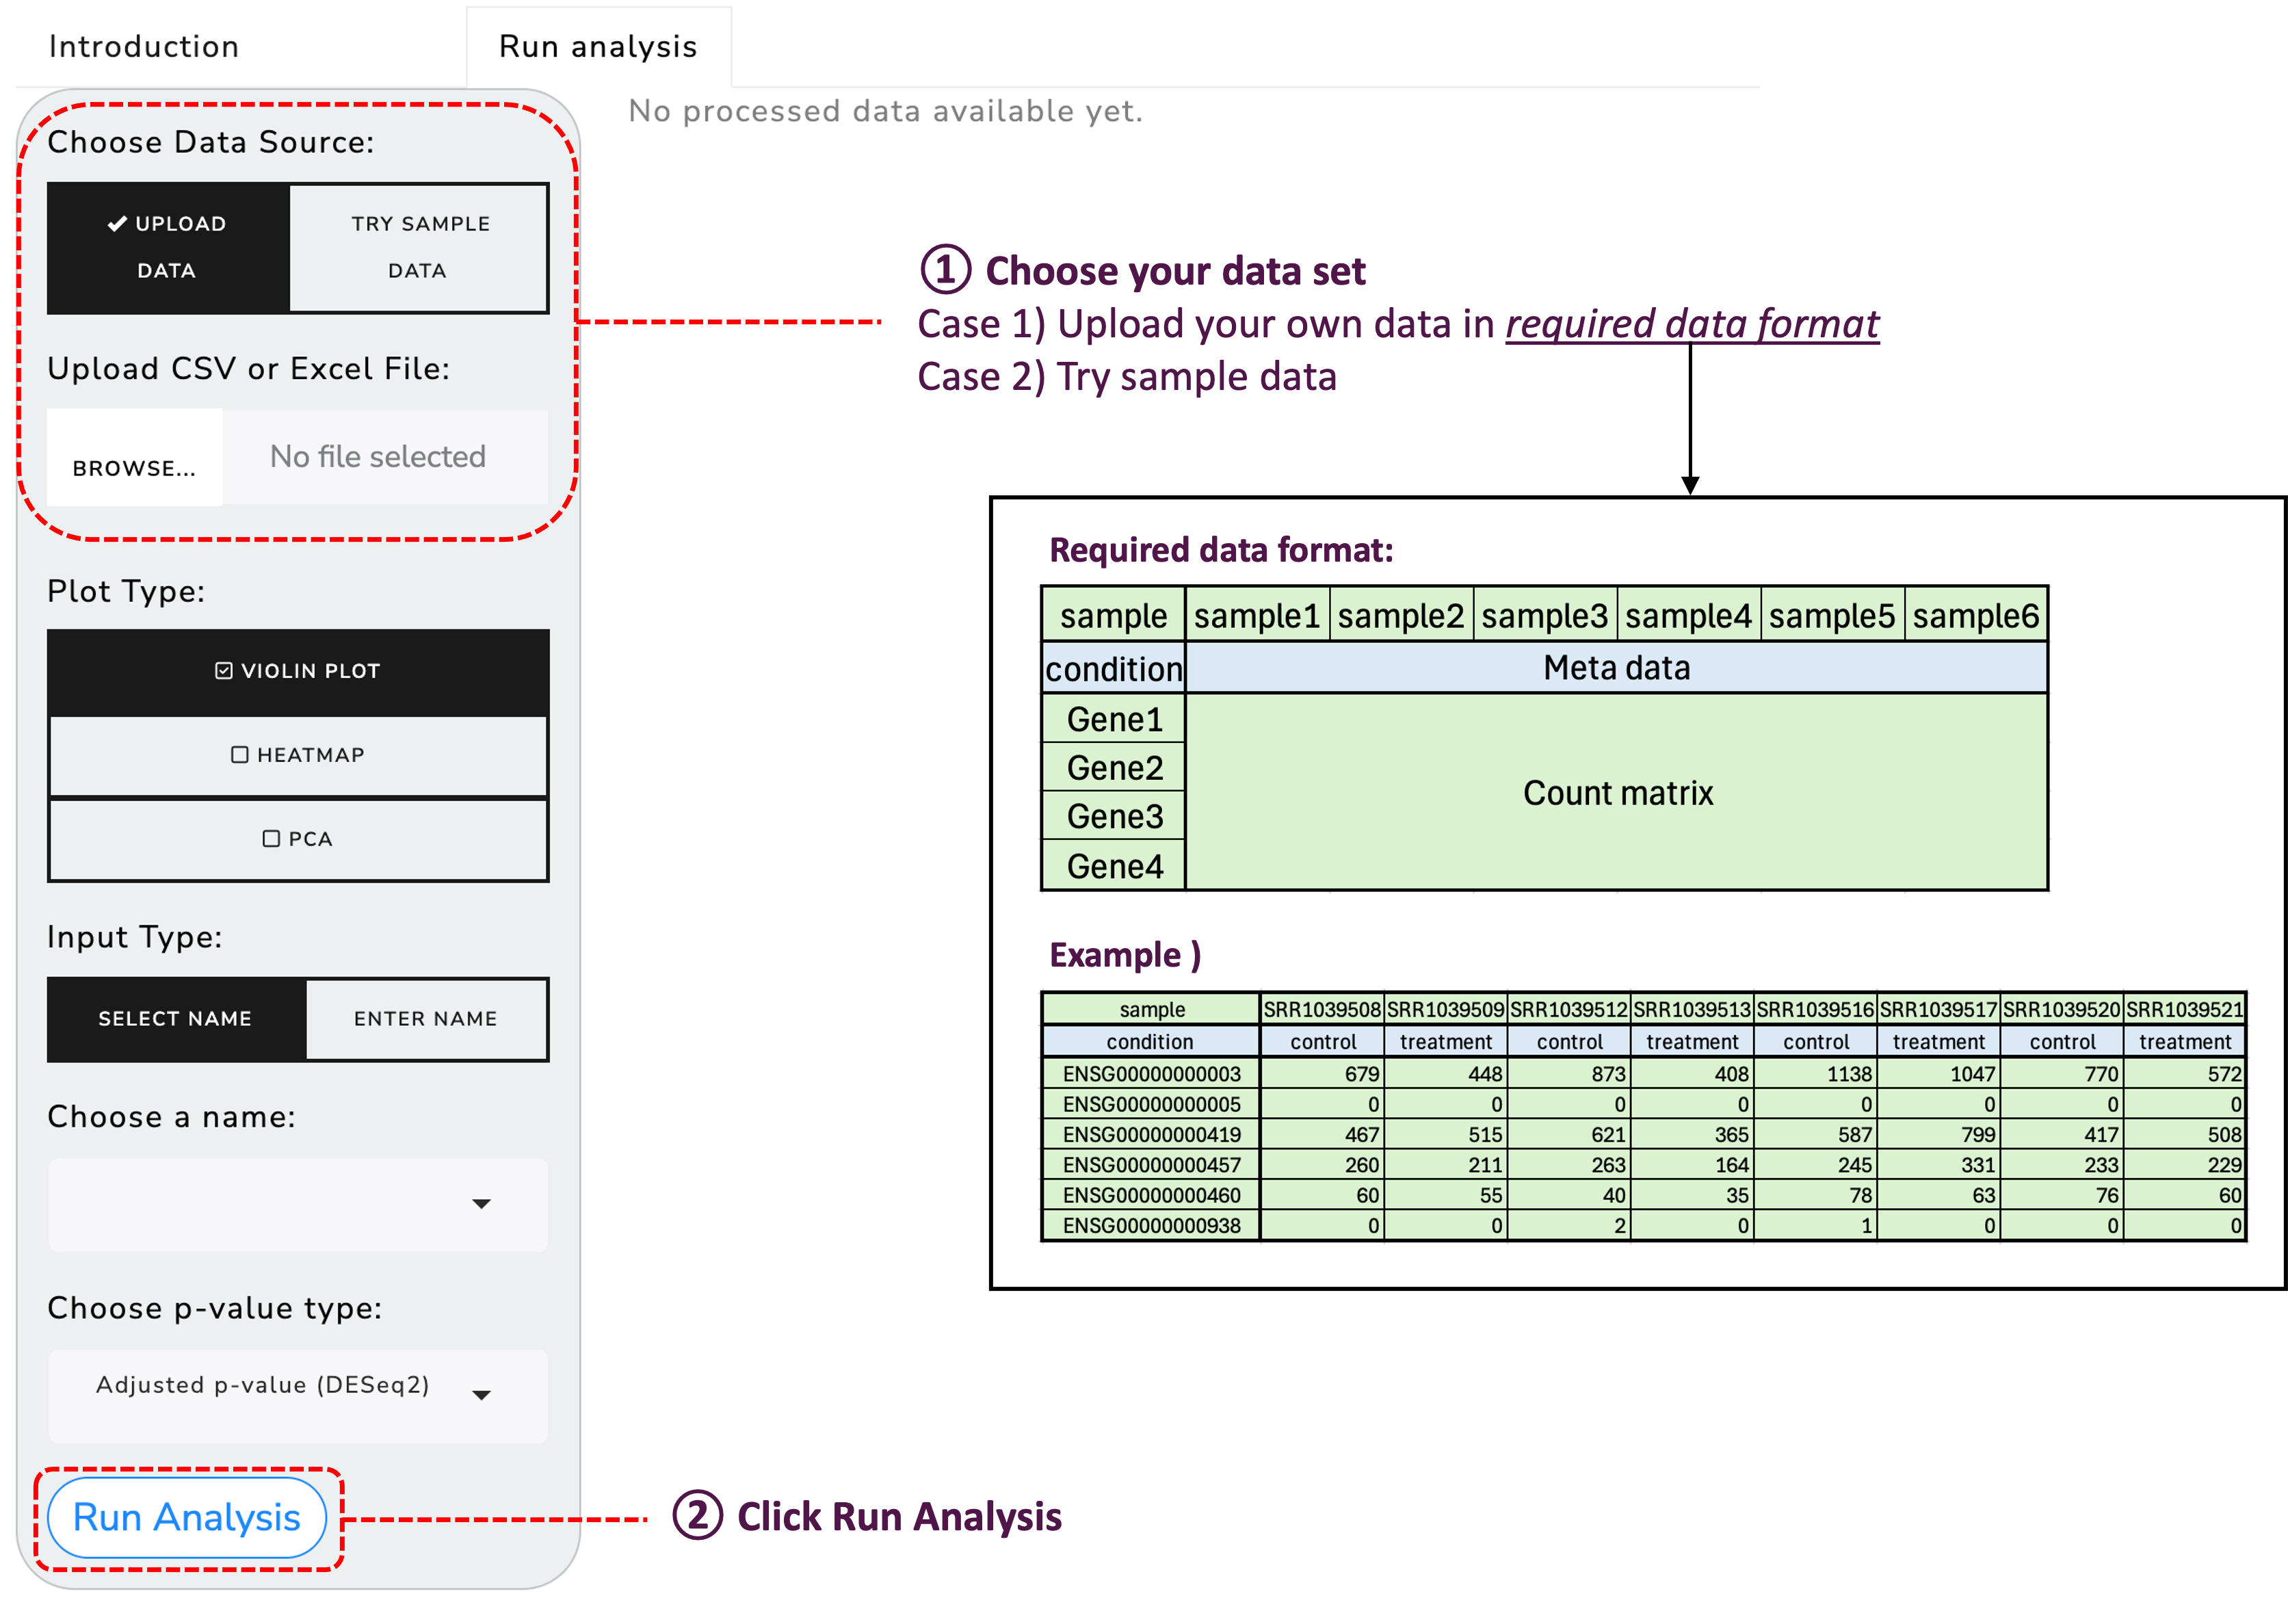
To get started, upload your RNA sequencing data using the provided functionality:
Once your data is uploaded, you can explore it through various visualization options:
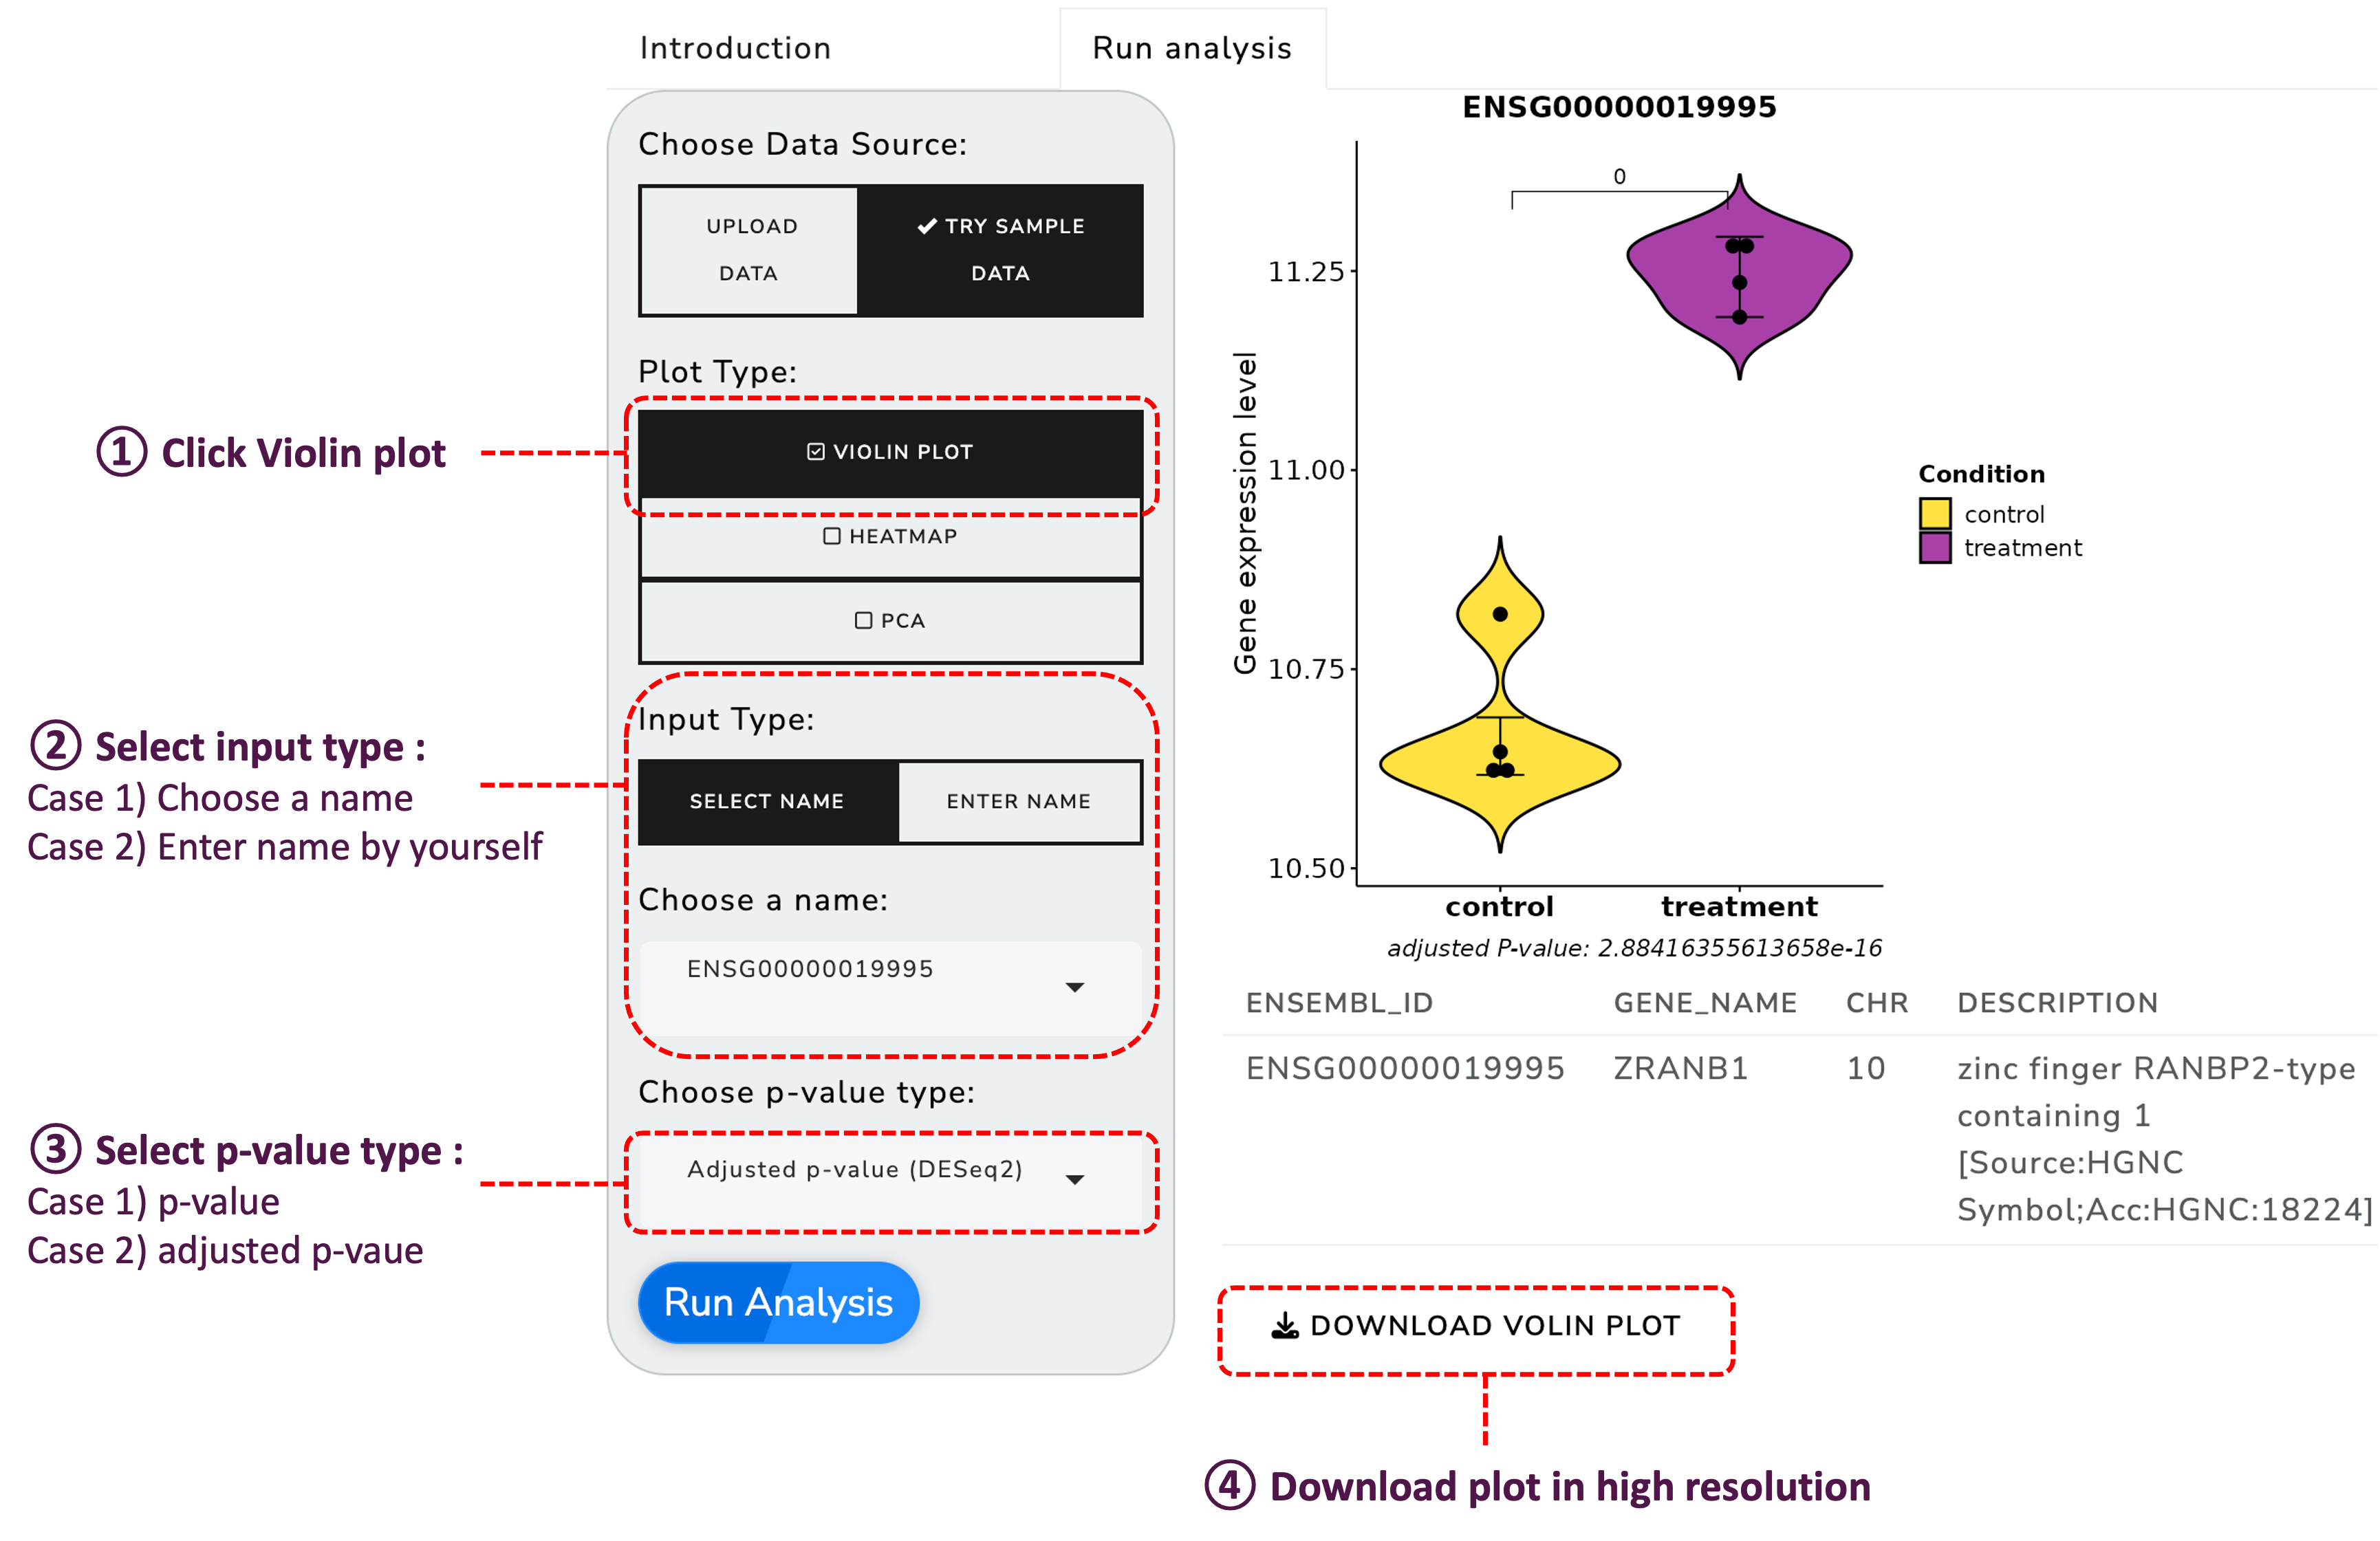
Generate violin plots to visualize the distribution of your data:
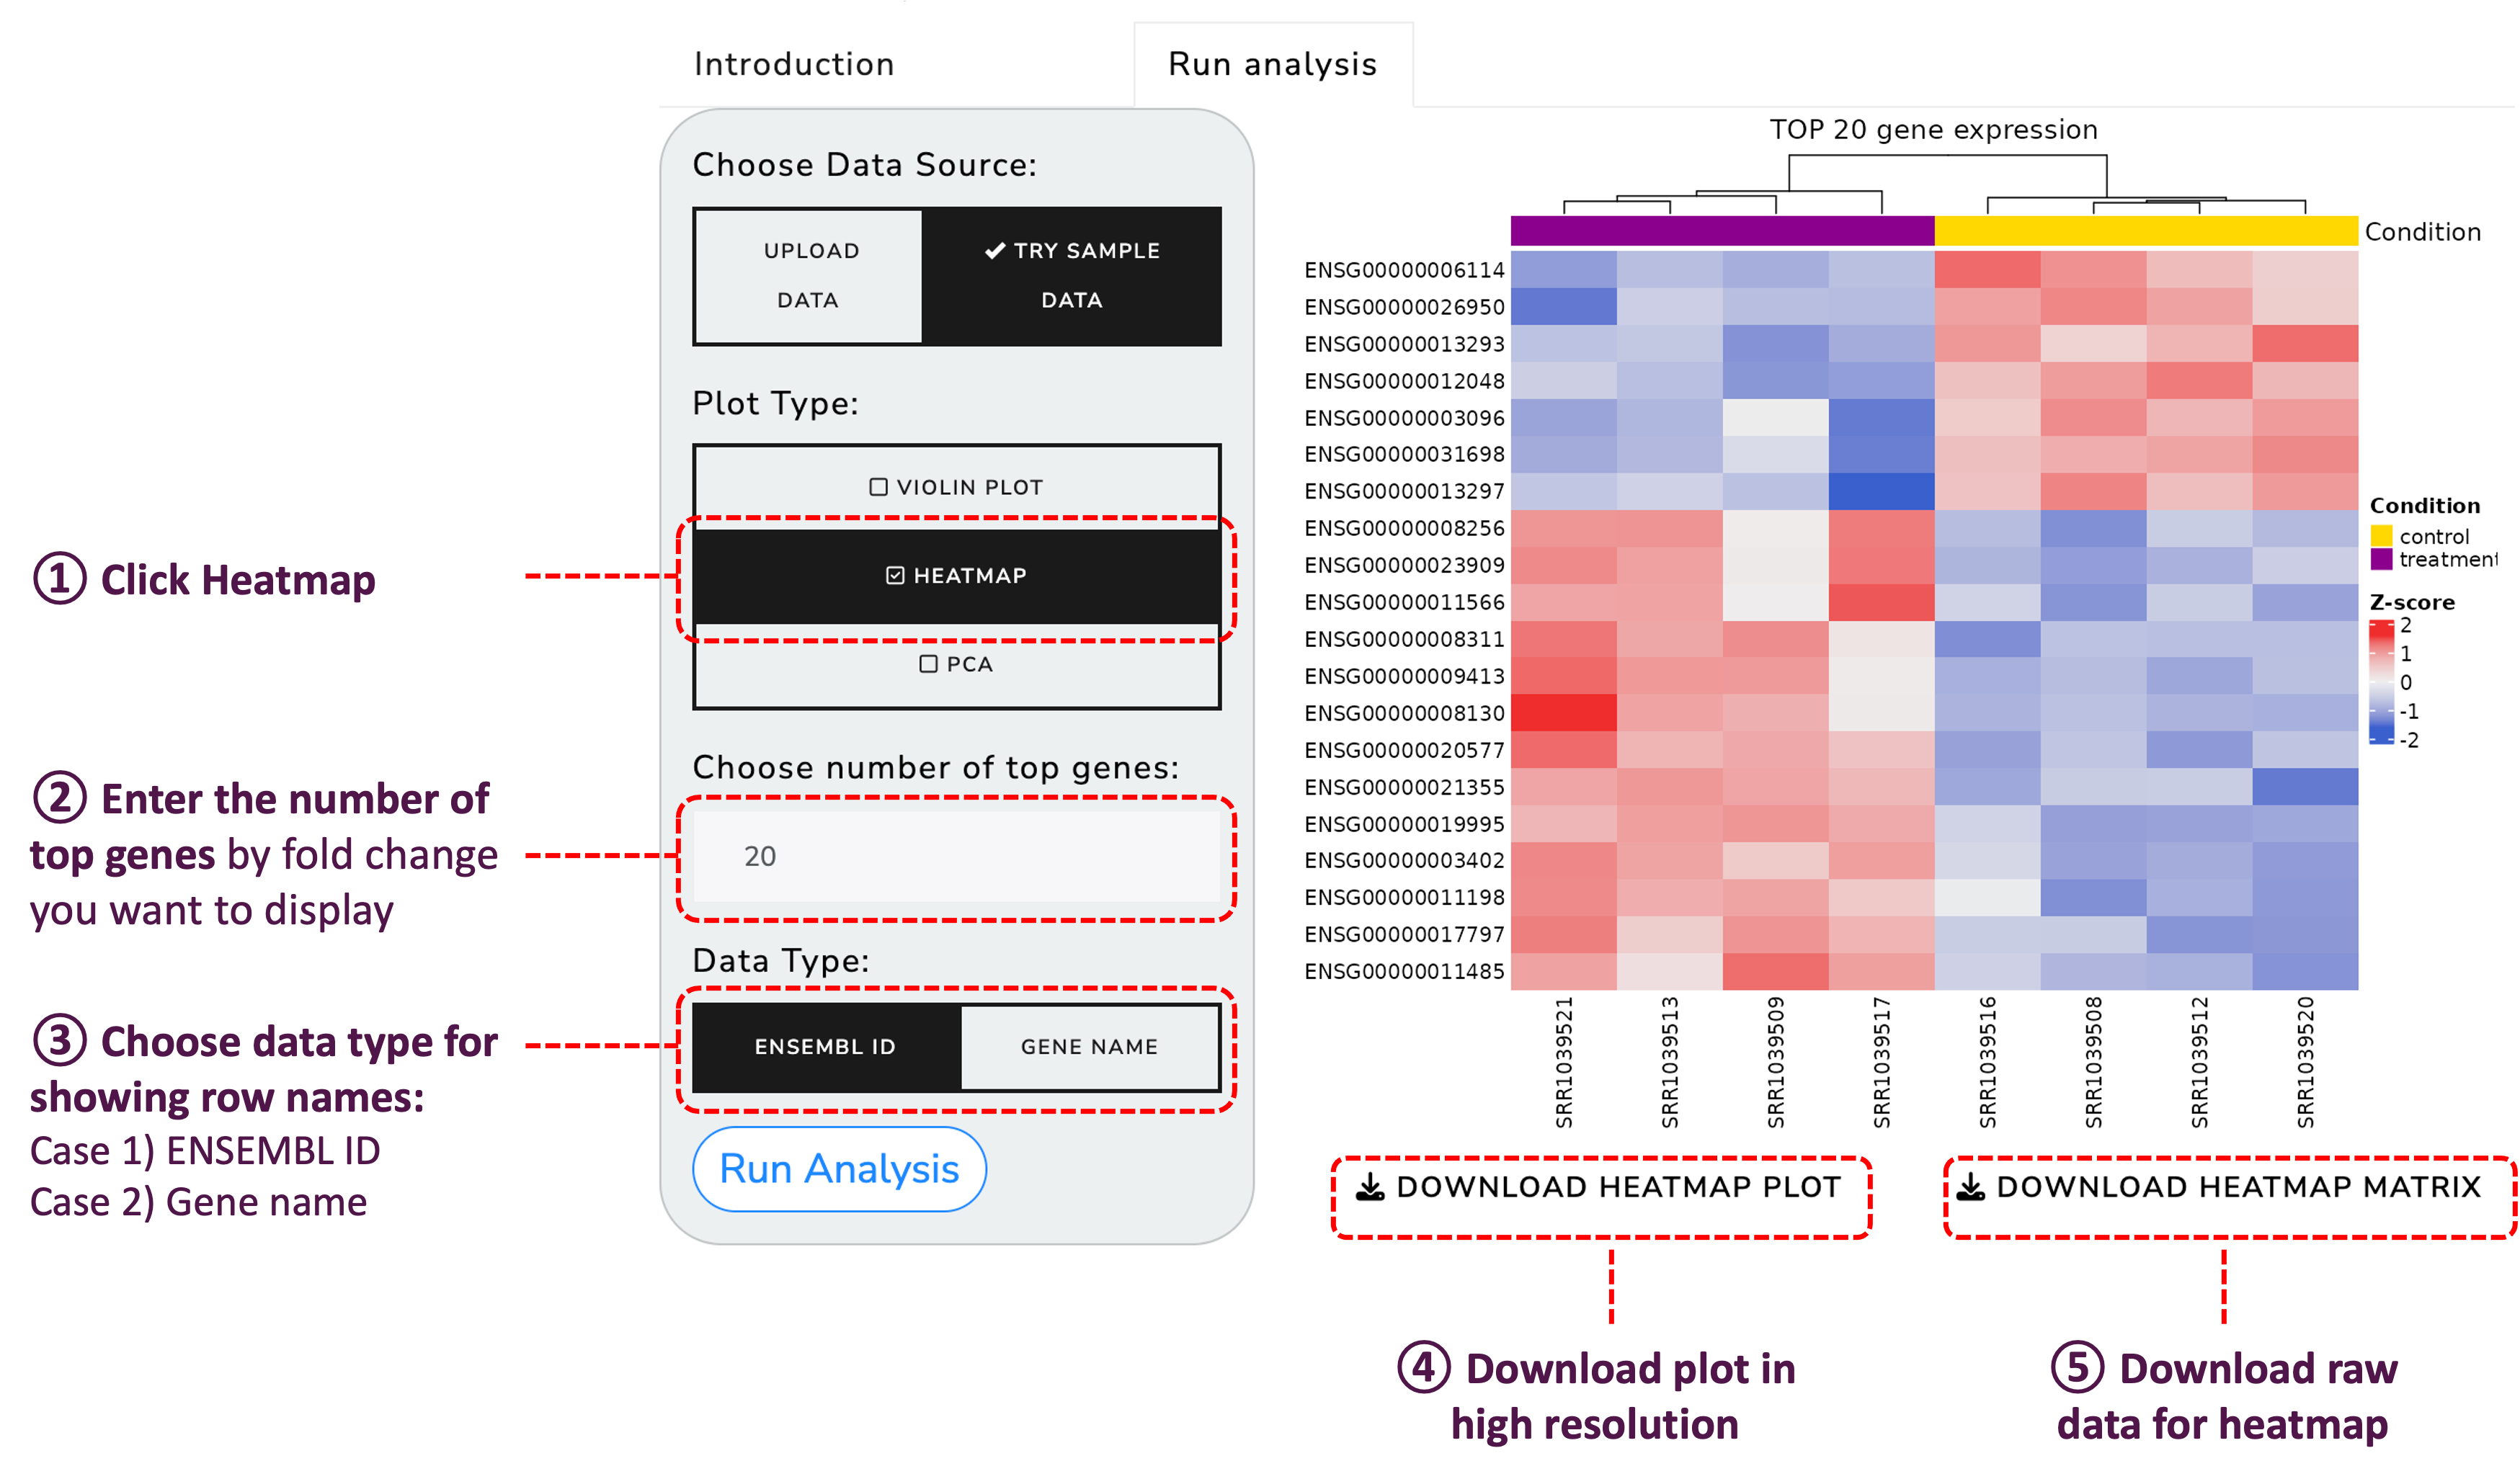
Create heatmaps for a detailed view of the gene expression levels:
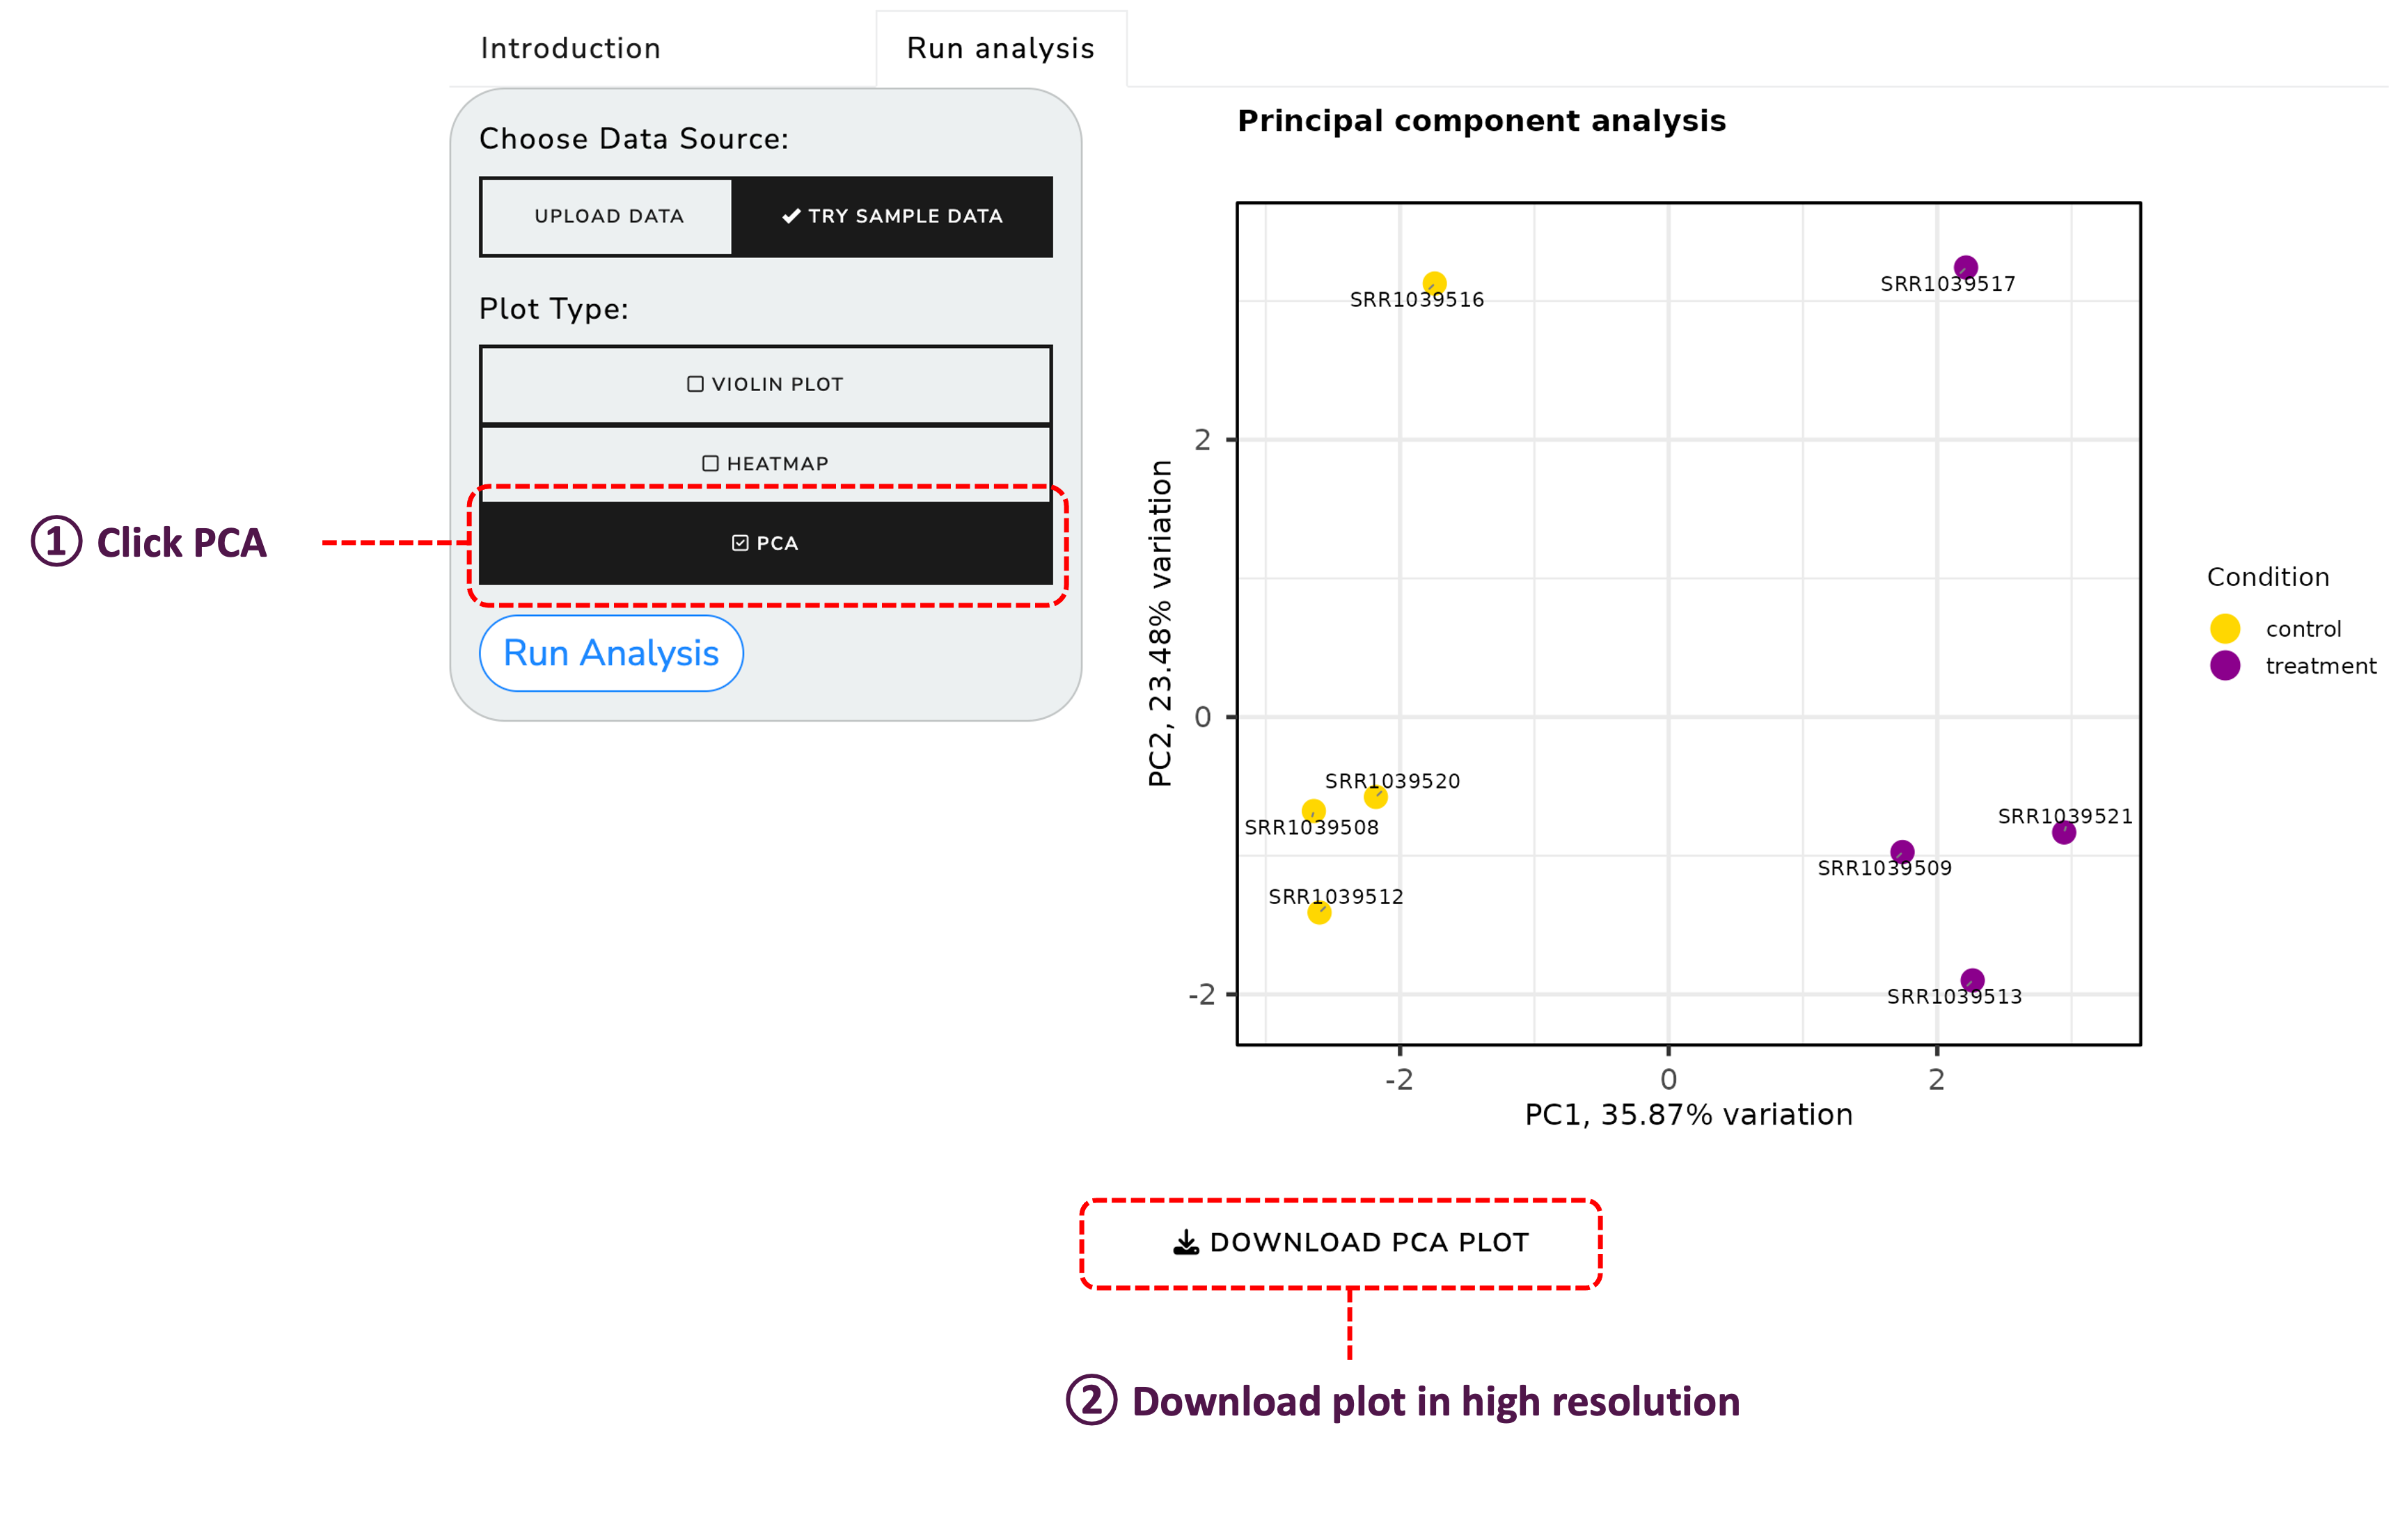
Perform Principal Component Analysis (PCA) to understand the variance in your data:
We welcome contributions to enhance the functionality and usability of RNAseq Explorer. Please feel free to submit a pull request or open an issue to discuss improvements.
This project is licensed under the GNU GENERAL PUBLIC LICENSE - see the LICENSE file for details.
If you use the rnaseqExplorer package in your research, please consider citing it as follows:
Jeongah Lee. (2024). rnaseqExplorer: A comprehensive Shiny application for analyzing RNA sequencing data (Version 0.1.0) [R package]. GitHub. https://github.com/jeongahblairlee/rnaseqExplorer
For any inquiries or issues, please contact Jeongah Lee.