Nearshore image classification
- Install poetry, a python package and virtual environment manager
- On macOS, in the terminal, run the command
brew install poetry(assuminghomebrewis installed. If not, install homebrew) - General installation instructions: install poetry
- On macOS, in the terminal, run the command
- Clone this repository by running
git clone git@github.com:madelinemberger/sediment-ml.gitor downloading the zip - Navigate into this repository
- Run the command
poetry installto set up the virtual environment for this repository
- After setting up the environment with
poetry(see Getting Started), you can run a script like this:- run the command
poetry run python path/to/script.py
- run the command
- After setting up the environment, you can launch Jupyter Notebook from within the environment like this:
- run the command
poetry run jupyter notebook
- run the command
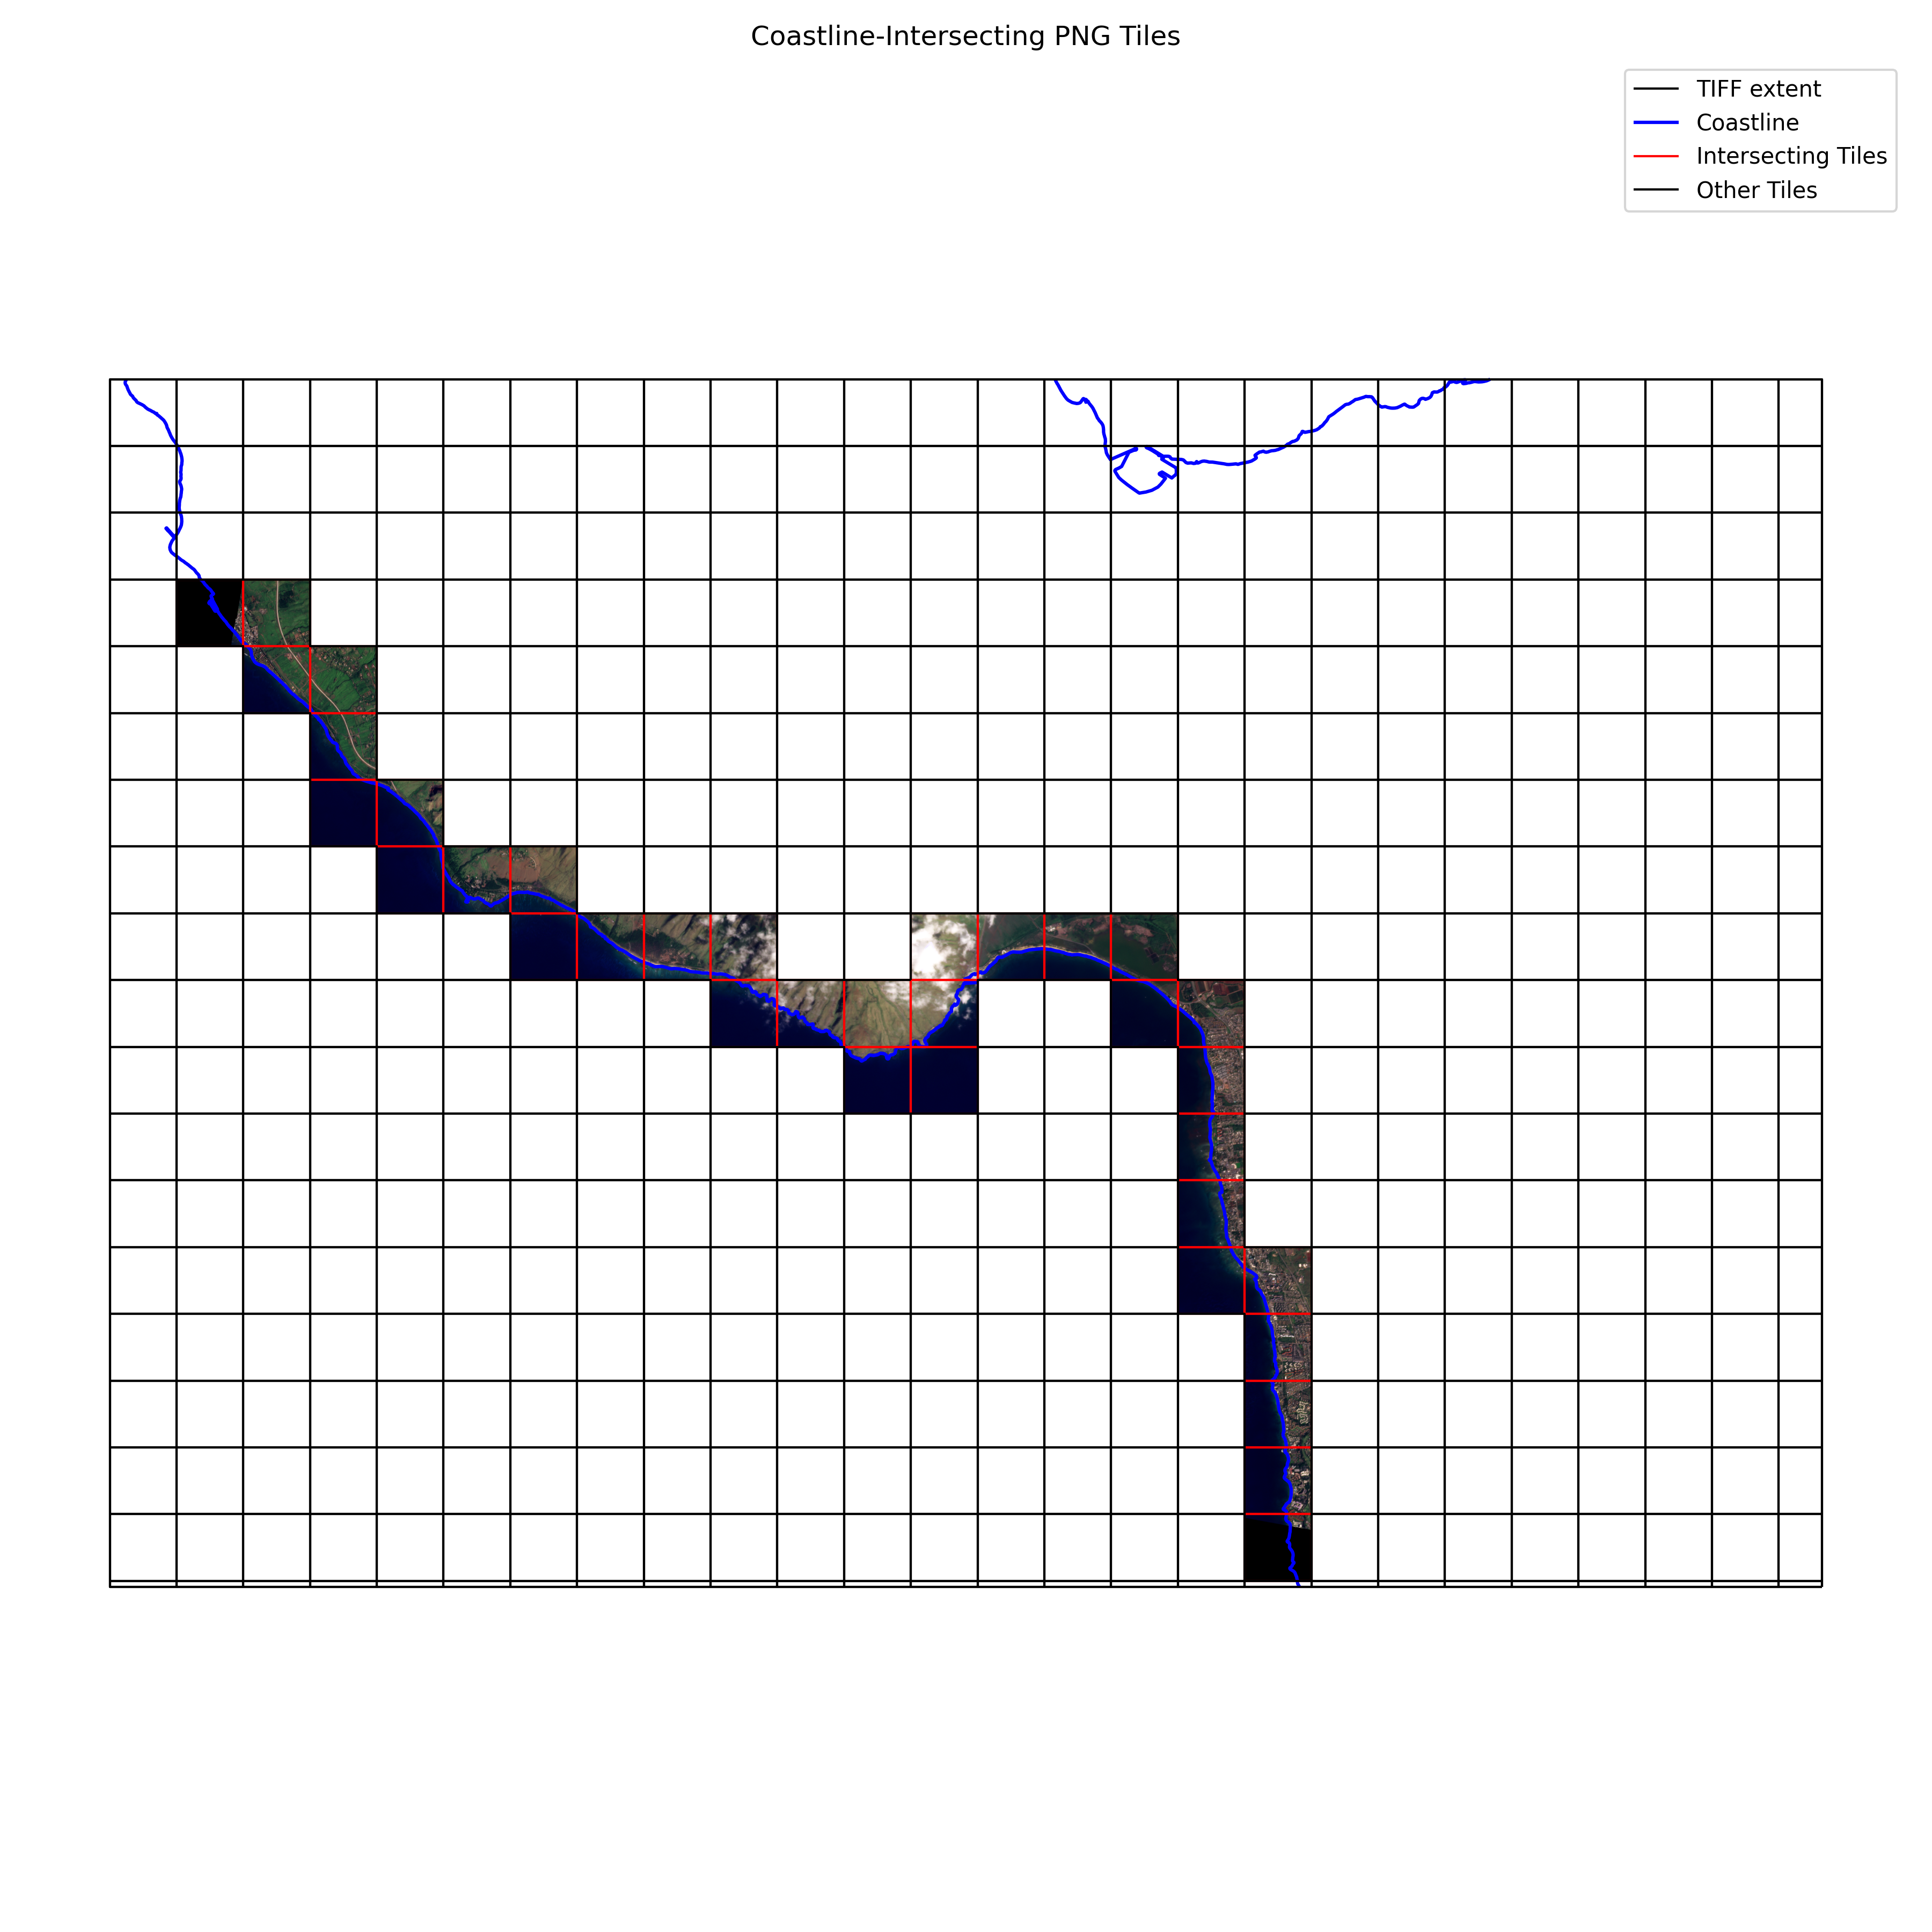
This script does the following: Given a .tif file and a shapefile bundle with coastline information that spans the region of the .tif file, this script will
- tile the .tif into NxN regions (default=512x512 pixels);
- determine which of these regions intersect the coastline;
- convert the intersecting regions to PNGs and save these files;
- create a map image showing the intersecting tiles as PNGs and the coastline contour, along with the .tif boundary
Example output from this script can be seen in examples/coastline_tiles_plot.png and below:
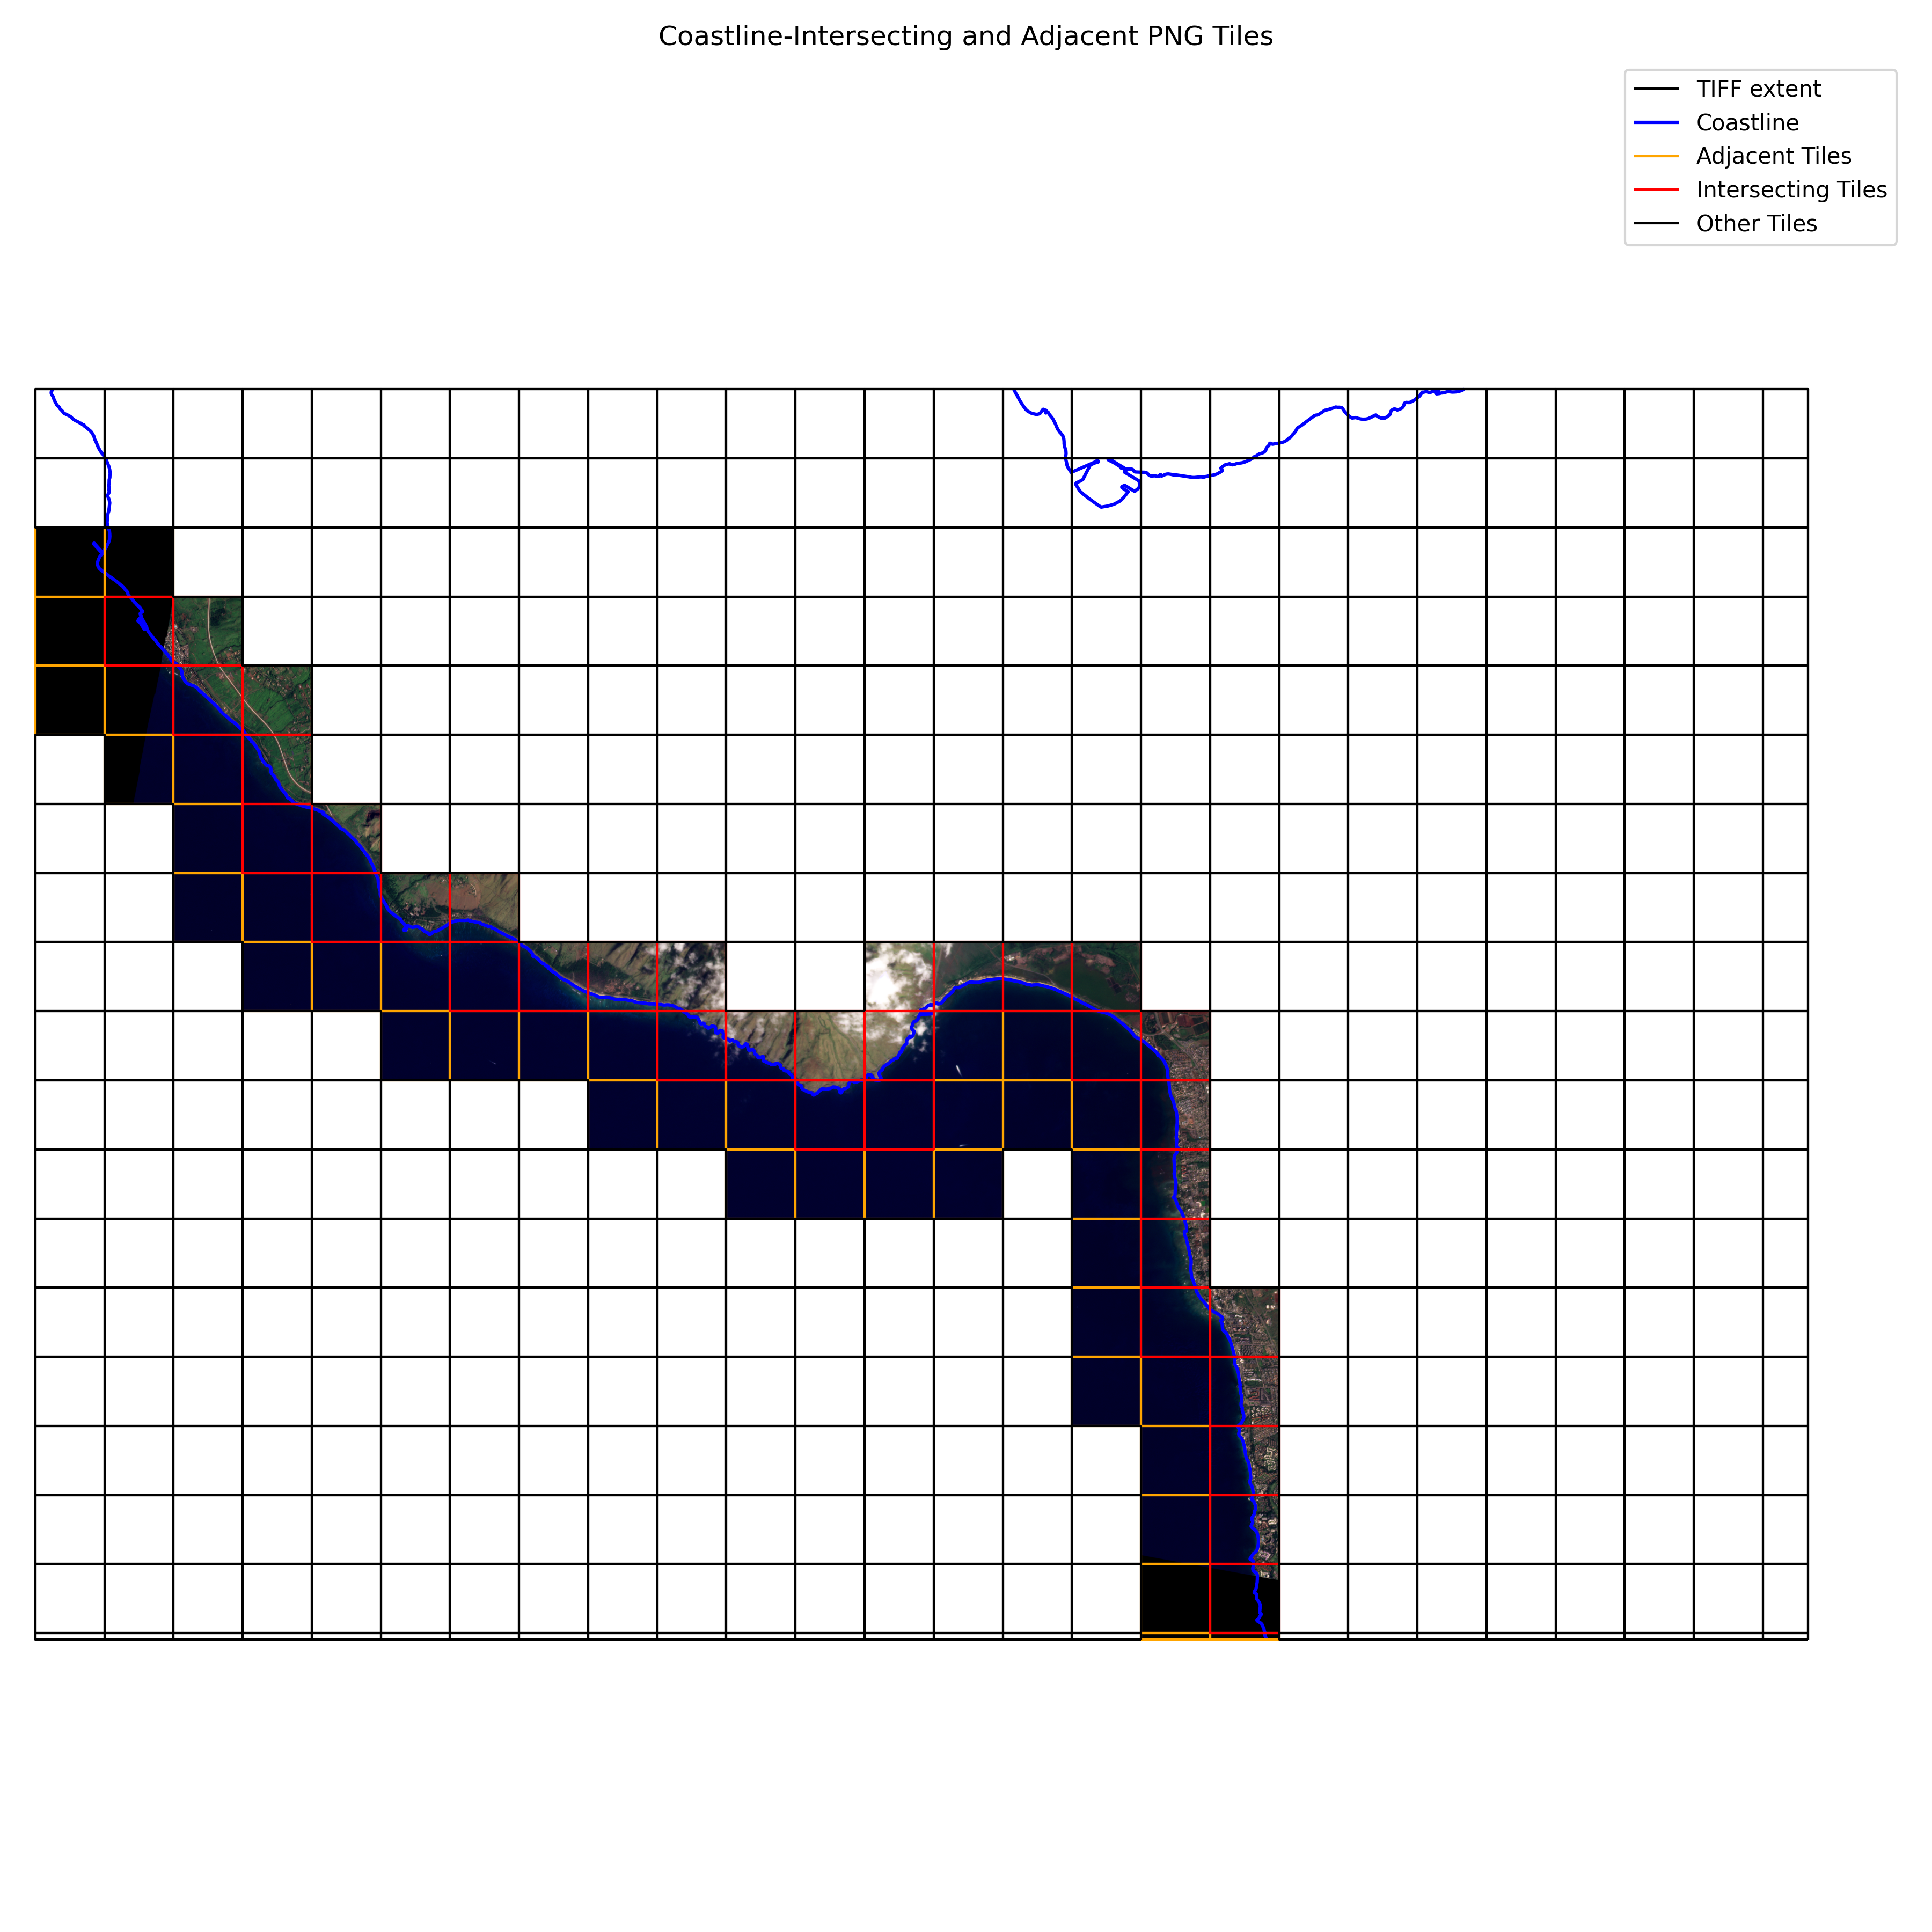
This script does the following: Given a .tif and a shapefile bundle with coastline information that spans the region of the .tif file, this script will
- tile the .tif in NxN regions (default=512x512 pixels),
- determine which of these regions intersect the coastline,
- determine which of the regions adjacent to intersecting regions are not contained within the landmass,
- convert the intersecting regions and adjacent, non-land regions to PNGs and save these files,
- create a map image showing the intersecting tiles as red-boundary PNGs, the adjacent non-land tiles as orange-boundary PNGs, and the coastline contour as a blue line, along with the .tif boundary as a black line
Example output from this script can be seen in examples/coastline_tiles_plot_extended.png and below: