Use Case: Within a firm there are technical incidents that get reported and later resolved. The problem is to find how many incidents will occur in future, this would help tech support to arrange tech support guys. Also we need to find the major cause for a particular incident
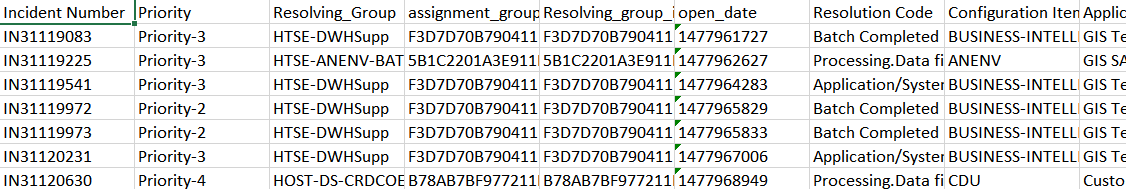
The dataset includes incidents that have occured from 2016-11-01 to 2017-04-30
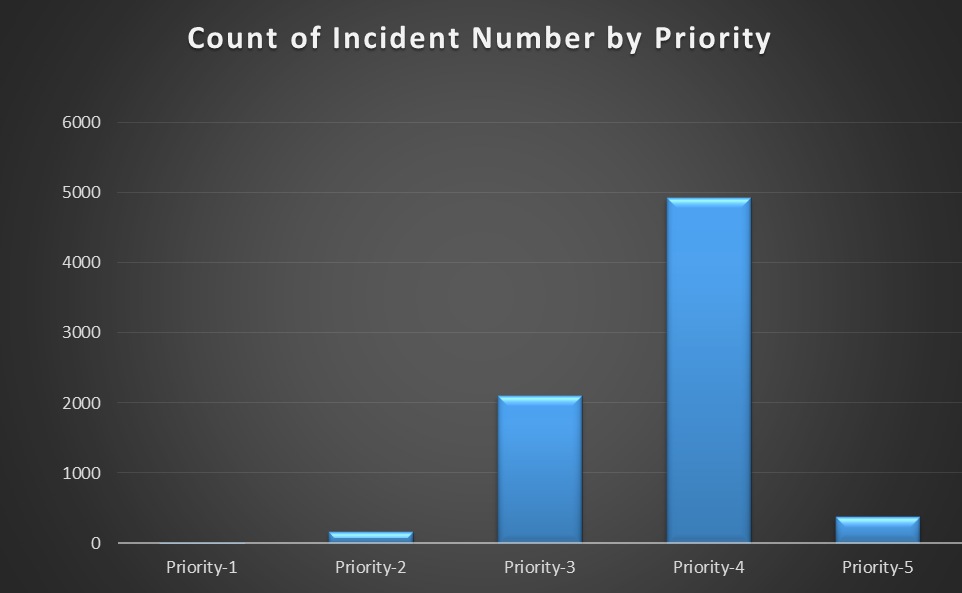
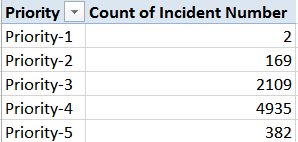
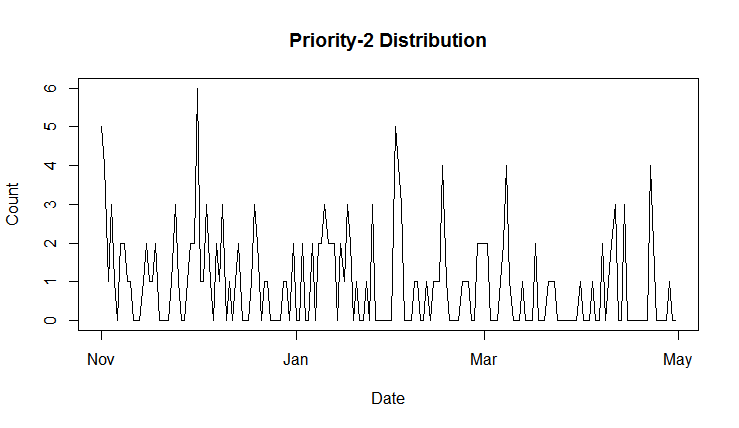
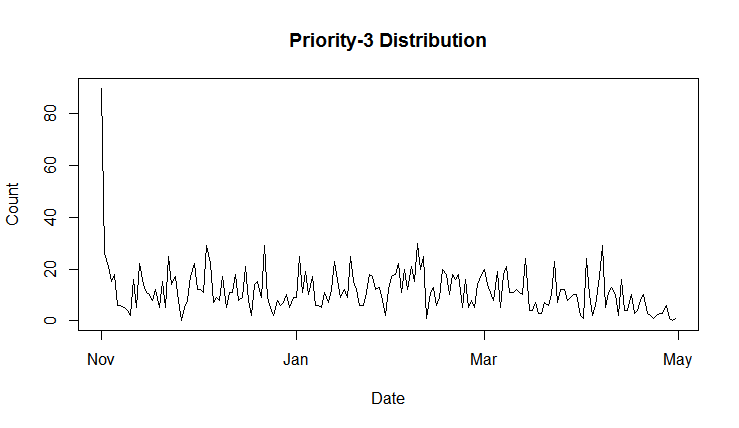
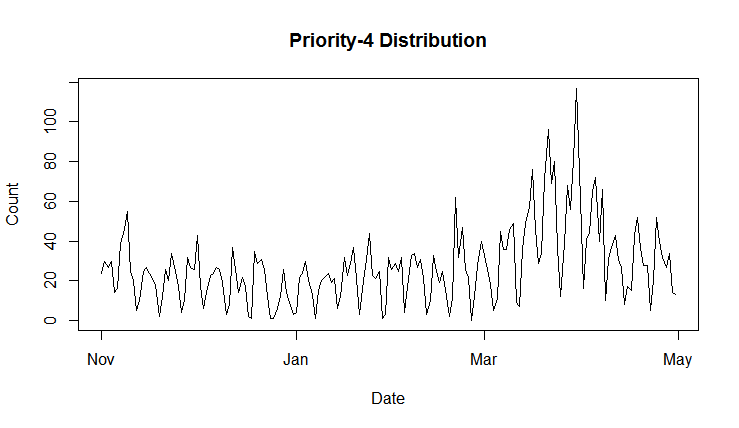
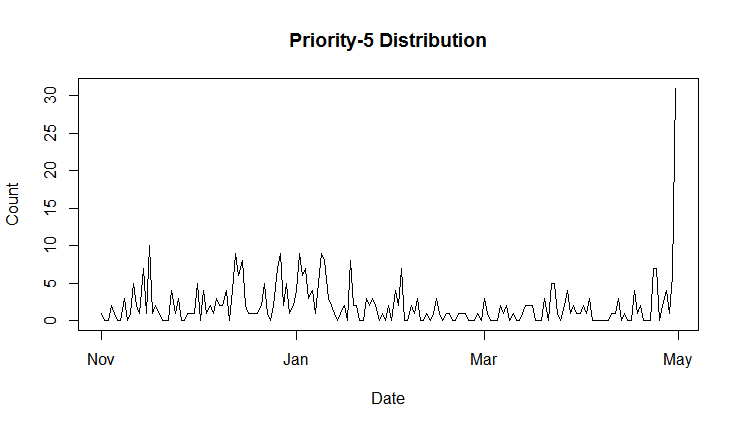
The following graph plots incidents priority wise
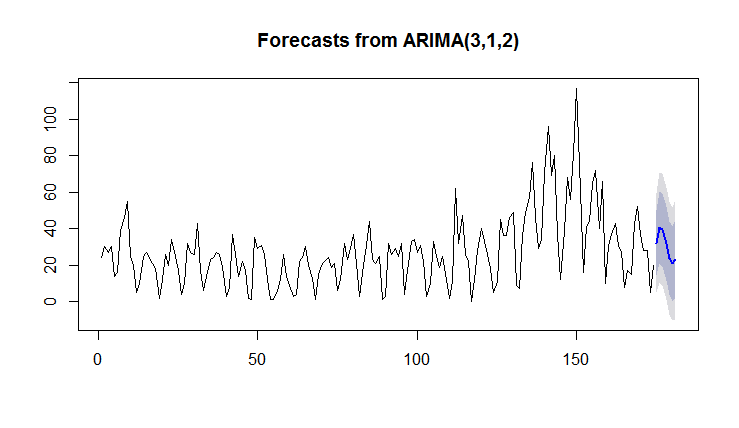
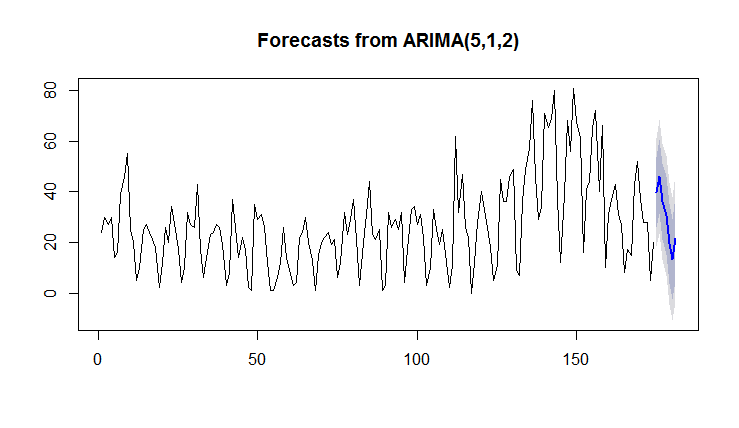
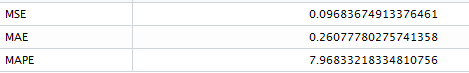
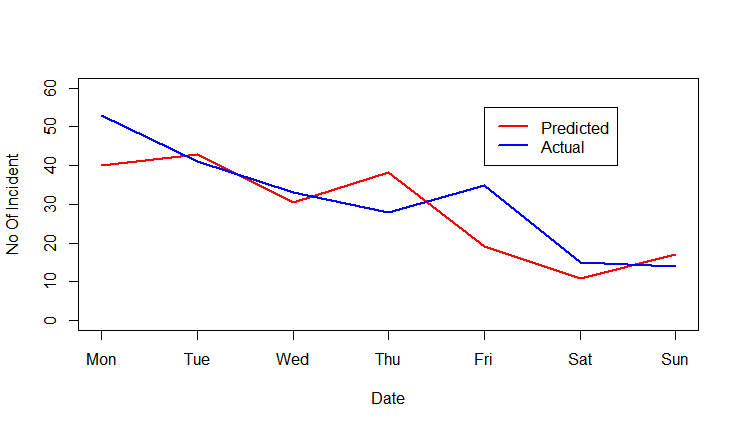
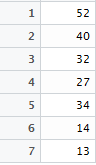
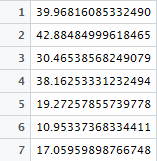
From 01/11/2016 To 23/04/2017
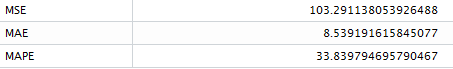
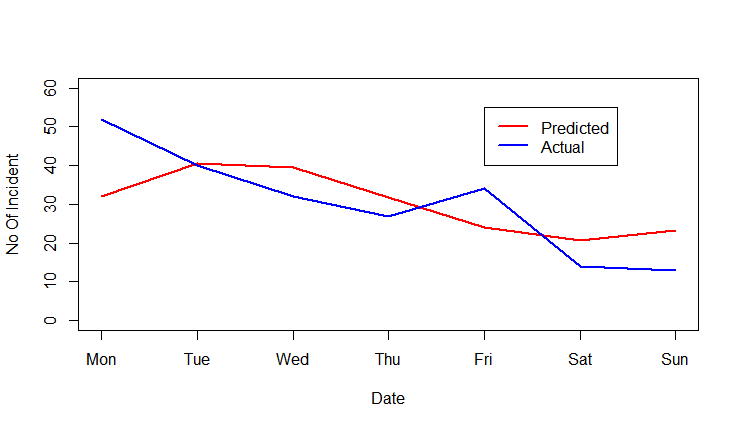
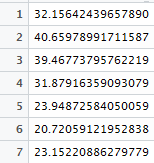
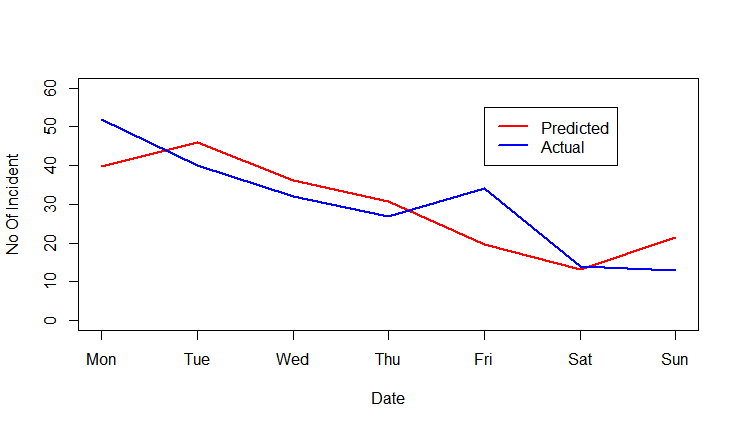
From 24/04/2017 To 30/04/2017