![]()

🧠 A Different Way to Work with Tabular Data
TidyChef is a Python tool designed to extract and tidy data from human-oriented spreadsheets and visually structured tabular data—the kind commonly published by governments, NGOs, analysts, and others.
Instead of relying on rigid cell references, TidyChef lets you define robust conditional selections and spatial relationships like “this value is below this header” or “the closest category above applies.” This approach makes your extraction scripts repeatable and resilient—even when layouts change or additional data is added to a source file.
📊 Built for real-world publication tables: ONS, NHS, DfE, local authority reports, and more.
| 👤 You are... | 🧩 Your problem... | ✅ Tidychef helps by... |
|---|---|---|
| A policy analyst | A quarterly Excel export with merged headers and wide layout | Extracting data using visual relationships, not cell indices |
| A finance/data consultant | Repetitive report formatting with shifting structures | Writing reusable “recipes” that adapt to visual changes |
| A data engineer | Need to automate legacy spreadsheets | Building robust, declarative extractors in Python |
AI-powered overview: See how tidychef compares to other tools.
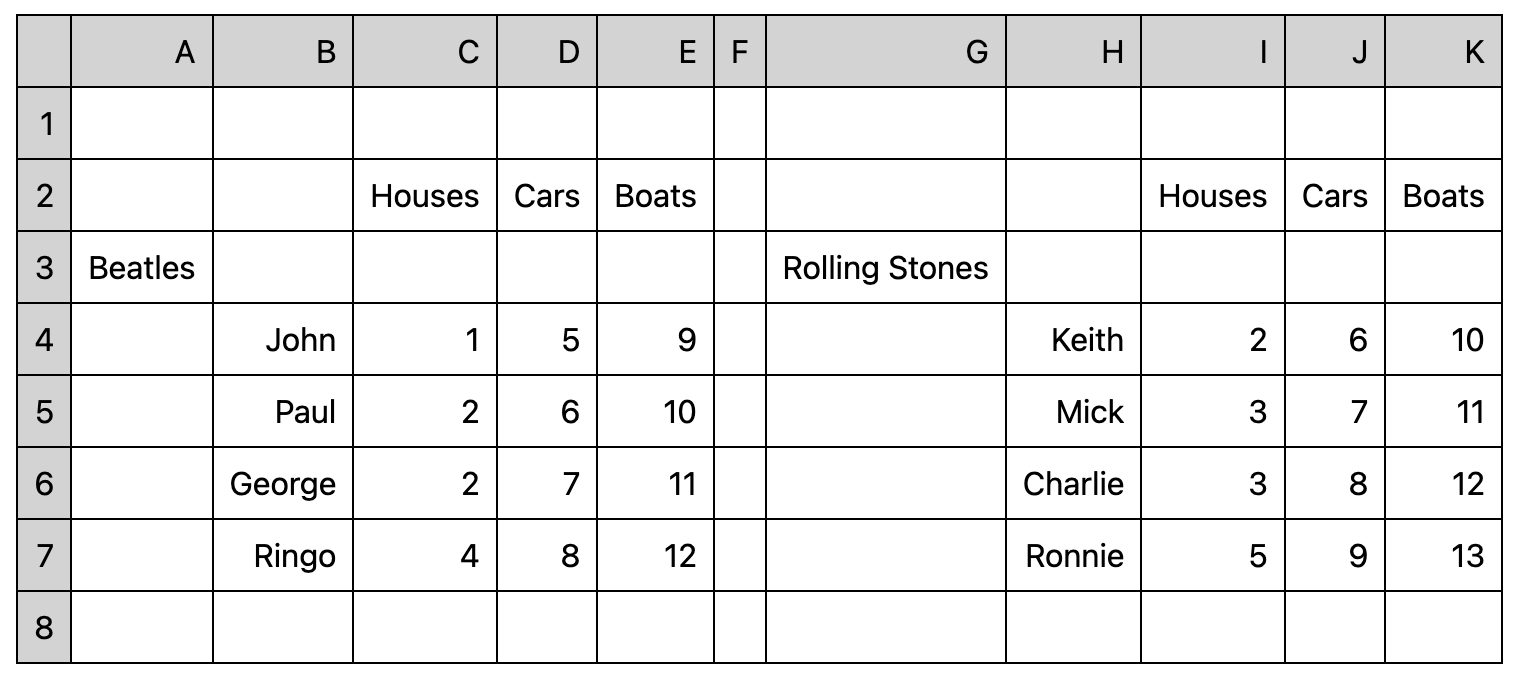
Consider this Excel-like structure — built for readers, not for code.
A simple script
from tidychef import acquire, filters, preview
from tidychef.direction import below, down, right
from tidychef.output import Column, TidyData

# Load a CSV table from a URL
table = acquire.csv.http(
    "https://raw.githubusercontent.com/mikeAdamss/tidychef/main/tests/fixtures/csv/bands-wide.csv"
)

# Select numeric observations and label them
observations = table.is_numeric().label_as("Value")

# Select headers and label them
bands = table.row_containing_strings(["Beatles"]).is_not_blank().label_as("Band")
assets = table.row_containing_strings(["Cars"]).is_not_blank().label_as("Asset")
names = table.cell_containing_string("Beatles").shift(down).expand_to_box().is_not_numeric().label_as("Name")

# We'll request a preview to see our selections
preview(observations, bands, assets, names)

# Build tidy data by attaching observations and headers
tidy_data = TidyData(
    observations,
    Column(bands.attach_closest(right)),
    Column(assets.attach_directly(below)),
    Column(names.attach_directly(right)),
)

# Export the tidy data to CSV
tidy_data.to_csv("bands_tidy.csv")
which will get you an inline preview (because we used preview() in the snippet)
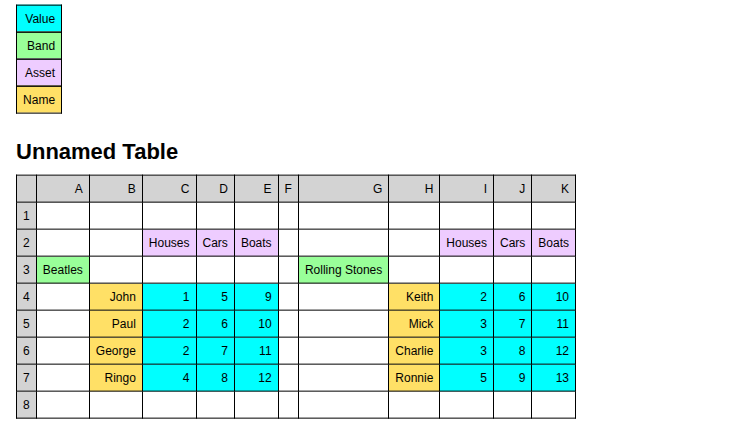
and will putput a csv (band_tidy.csv as per the snippet) that looks like this:

Note: image cropped for reasons of practicality.
💡 💡 KEY INSIGHT 💡💡
This is the bit you need to understand above all - here’s another preview I've made from running the exact same script against a radically altered version of the data source. This is what we mean by robust and repeatable transformations and why the focus of tidychef is modeling spatial relationships — how cells relate visually.
💡 Same script, radically different input—same output structure.
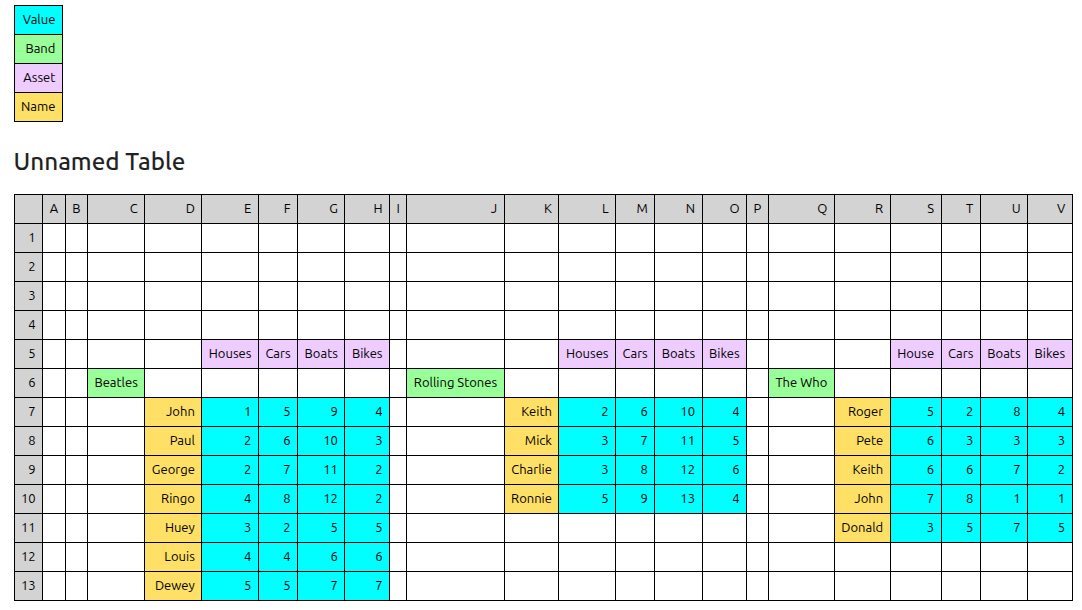
📌 You’re modeling visual structure, not fixed coordinates!
🧠 Visual logic — Work like a human, not like a parser.
🔁 Repeatable recipes — Robust to changes in layout, column order, or row spacing.
📦 Tidy output — Standard pandas.DataFrame or CSV.
🤝 Beginner-friendly — Analysts can learn fast with real-world examples.
🛠️ Advanced extensibility — Developers can subclass, extend, and customize as needed.
Extensive documentation, including tutorials, real UK government datasets, advanced recipes, and developer guidance is available at:
👉 mikeadamss.github.io/tidychef
pip install tidychef
Tidychef is directly inspired by the python package databaker created by The Sensible Code Company in partnership with the United Kingdoms Office For National Statistics.
While I liked databaker and successfully worked with it on multiple ETL projects over the course of almost a decade, I do consider this software the culmination of that work and the lessons learned from that time.
Please raise issues (or ideas as issues) freely on this repo.
If you'd like to get involved more directly then please see contributing guidance.