This GitHub repository contains the analysis scripts referring to our manuscript entitled 'Linking brain age gap to mental and physical health in the Berlin Aging Study II'. We provide a reproducible and portable R environment, all statistical analysis scripts, along with several interactive web-based graphs that summarize our results.
From a biological perspective, humans differ in the speed they age, and this may manifest in both mental and physical health disparities. The discrepancy between an individual’s biological and chronological age of the brain (‘brain age gap’) can be assessed by applying machine learning techniques to Magnetic Resonance Imaging (MRI) data. Here, we examined the links between brain age gap and a broad range of cognitive, affective, socioeconomic, lifestyle, and physical health variables in up to 335 adults of the Berlin Aging Study II. Brain age gap was assessed using a validated prediction model that we previously trained on MRI scans of 32,634 UK Biobank individuals. Our statistical analyses revealed overall stronger evidence for a link between higher brain age gap and less favorable health characteristics than expected under the null hypothesis of no effect, with 80% of the tested associations showing hypothesis-consistent effect directions and 23% reaching nominal significance. The most compelling support was observed for a cluster covering both cognitive performance variables (episodic memory, working memory, fluid intelligence, digit symbol substitution test) and socioeconomic variables (years of education and household income). Furthermore, we observed higher brain age gap to be associated with heavy episodic drinking, higher blood pressure, and higher blood glucose. In sum, our results point towards multifaceted links between brain age gap and human health. Understanding differences in biological brain aging may therefore have broad implications for future informed interventions to preserve mental and physical health in old age.
Keywords: aging, brain age, cognition, mental health, Berlin Aging Study II (BASE-II)
code - contains all analysis scripts as well as the extracted tables, figures and required Matlab functions
renv - contains a single file to initiate the R environment (the scripts located in code refer to this file)
renv.lock - a list of R packages automatically downloaded and attached to the R environment of this project
In order to inspect the code on your local device, you may clone this repository via the following commands:
git clone https://github.com/pjawinski/base2.git
cd base2
You are now ready to inspect the code and extraced files on your local drive. Running the code currently requires the original dataset. The data presented in our manuscript is available upon request from the BASE-II office. The data are not publicly available due to them containing information that could compromise research participant privacy/consent.
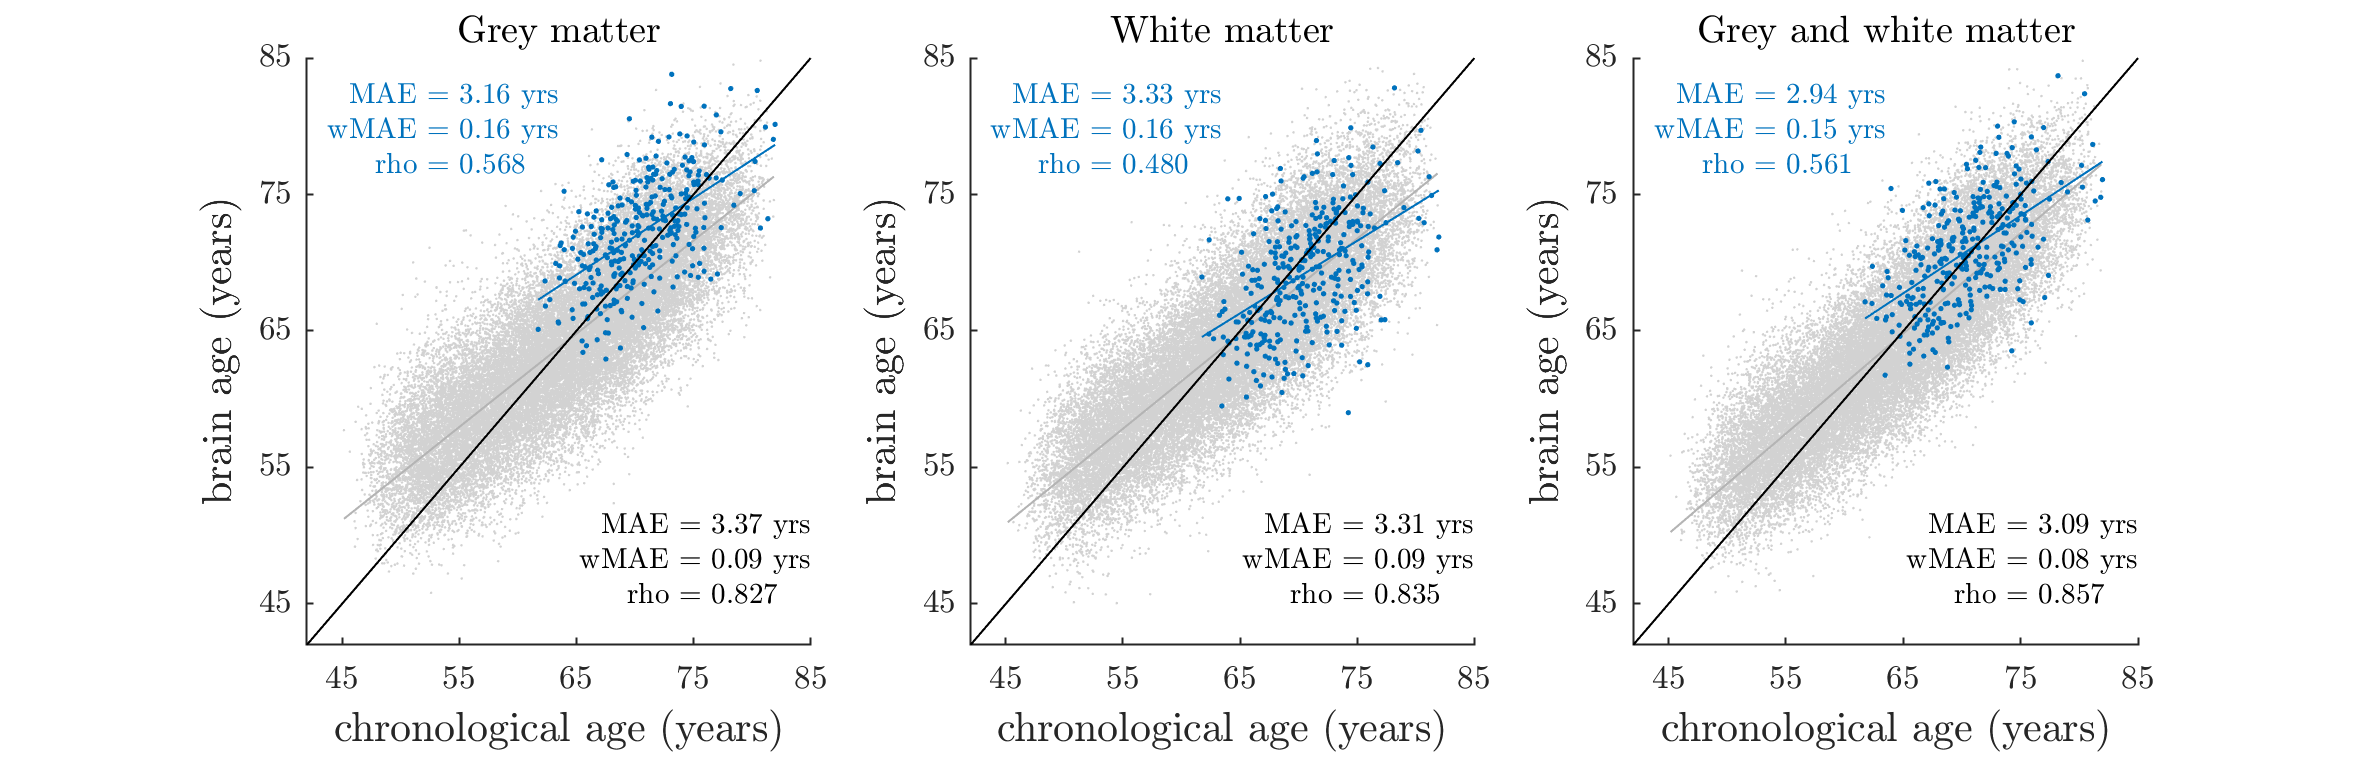
Fig. 1 - Brain-predicted (‘brain age’) vs. chronological age stratified by sample and tissue class (static)
Fig. 2 - Partial Pearson correlations between brain age gap and 27 outcome variables (interactive)
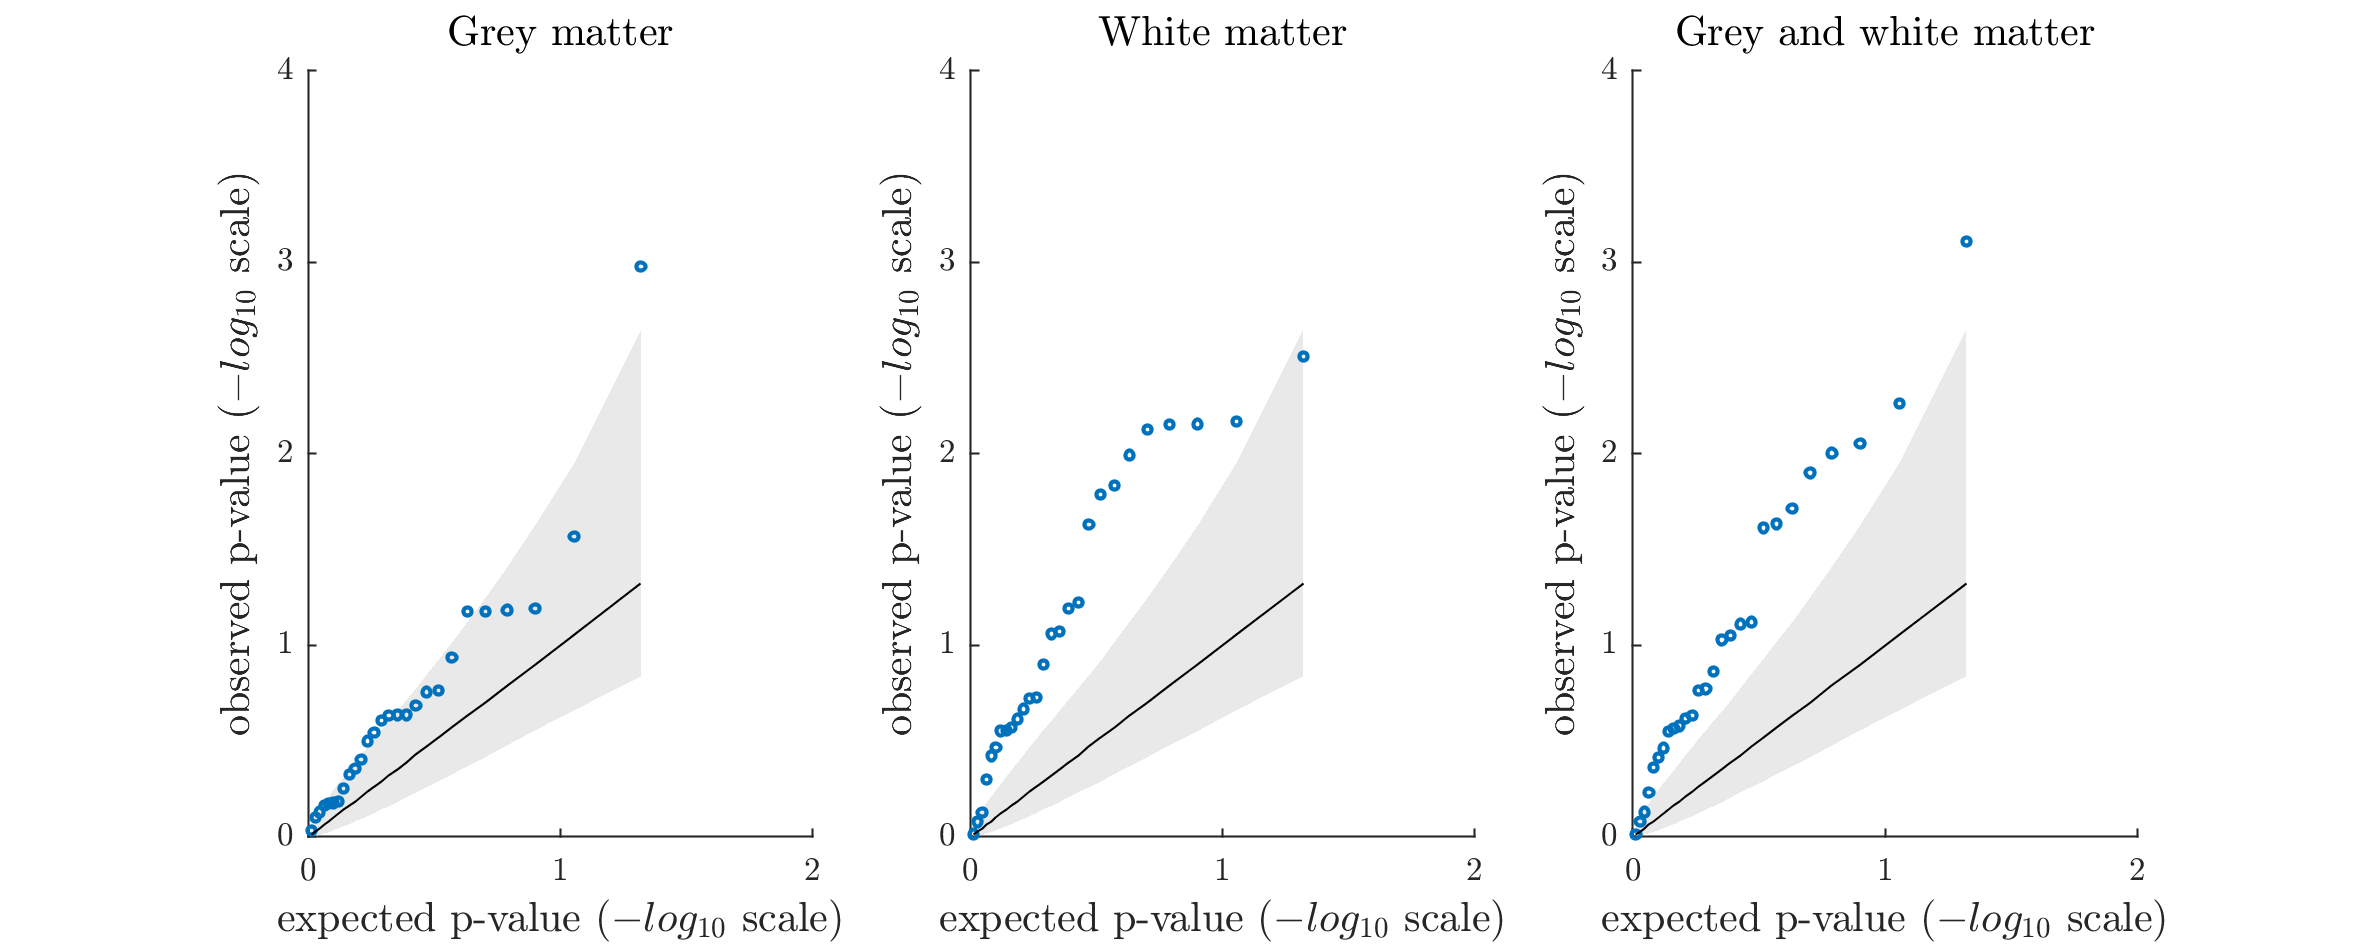
Fig. 3 - Permutation-based qq-plots showing the distribution of observed vs. expected p-values stratified by tissue type (static)
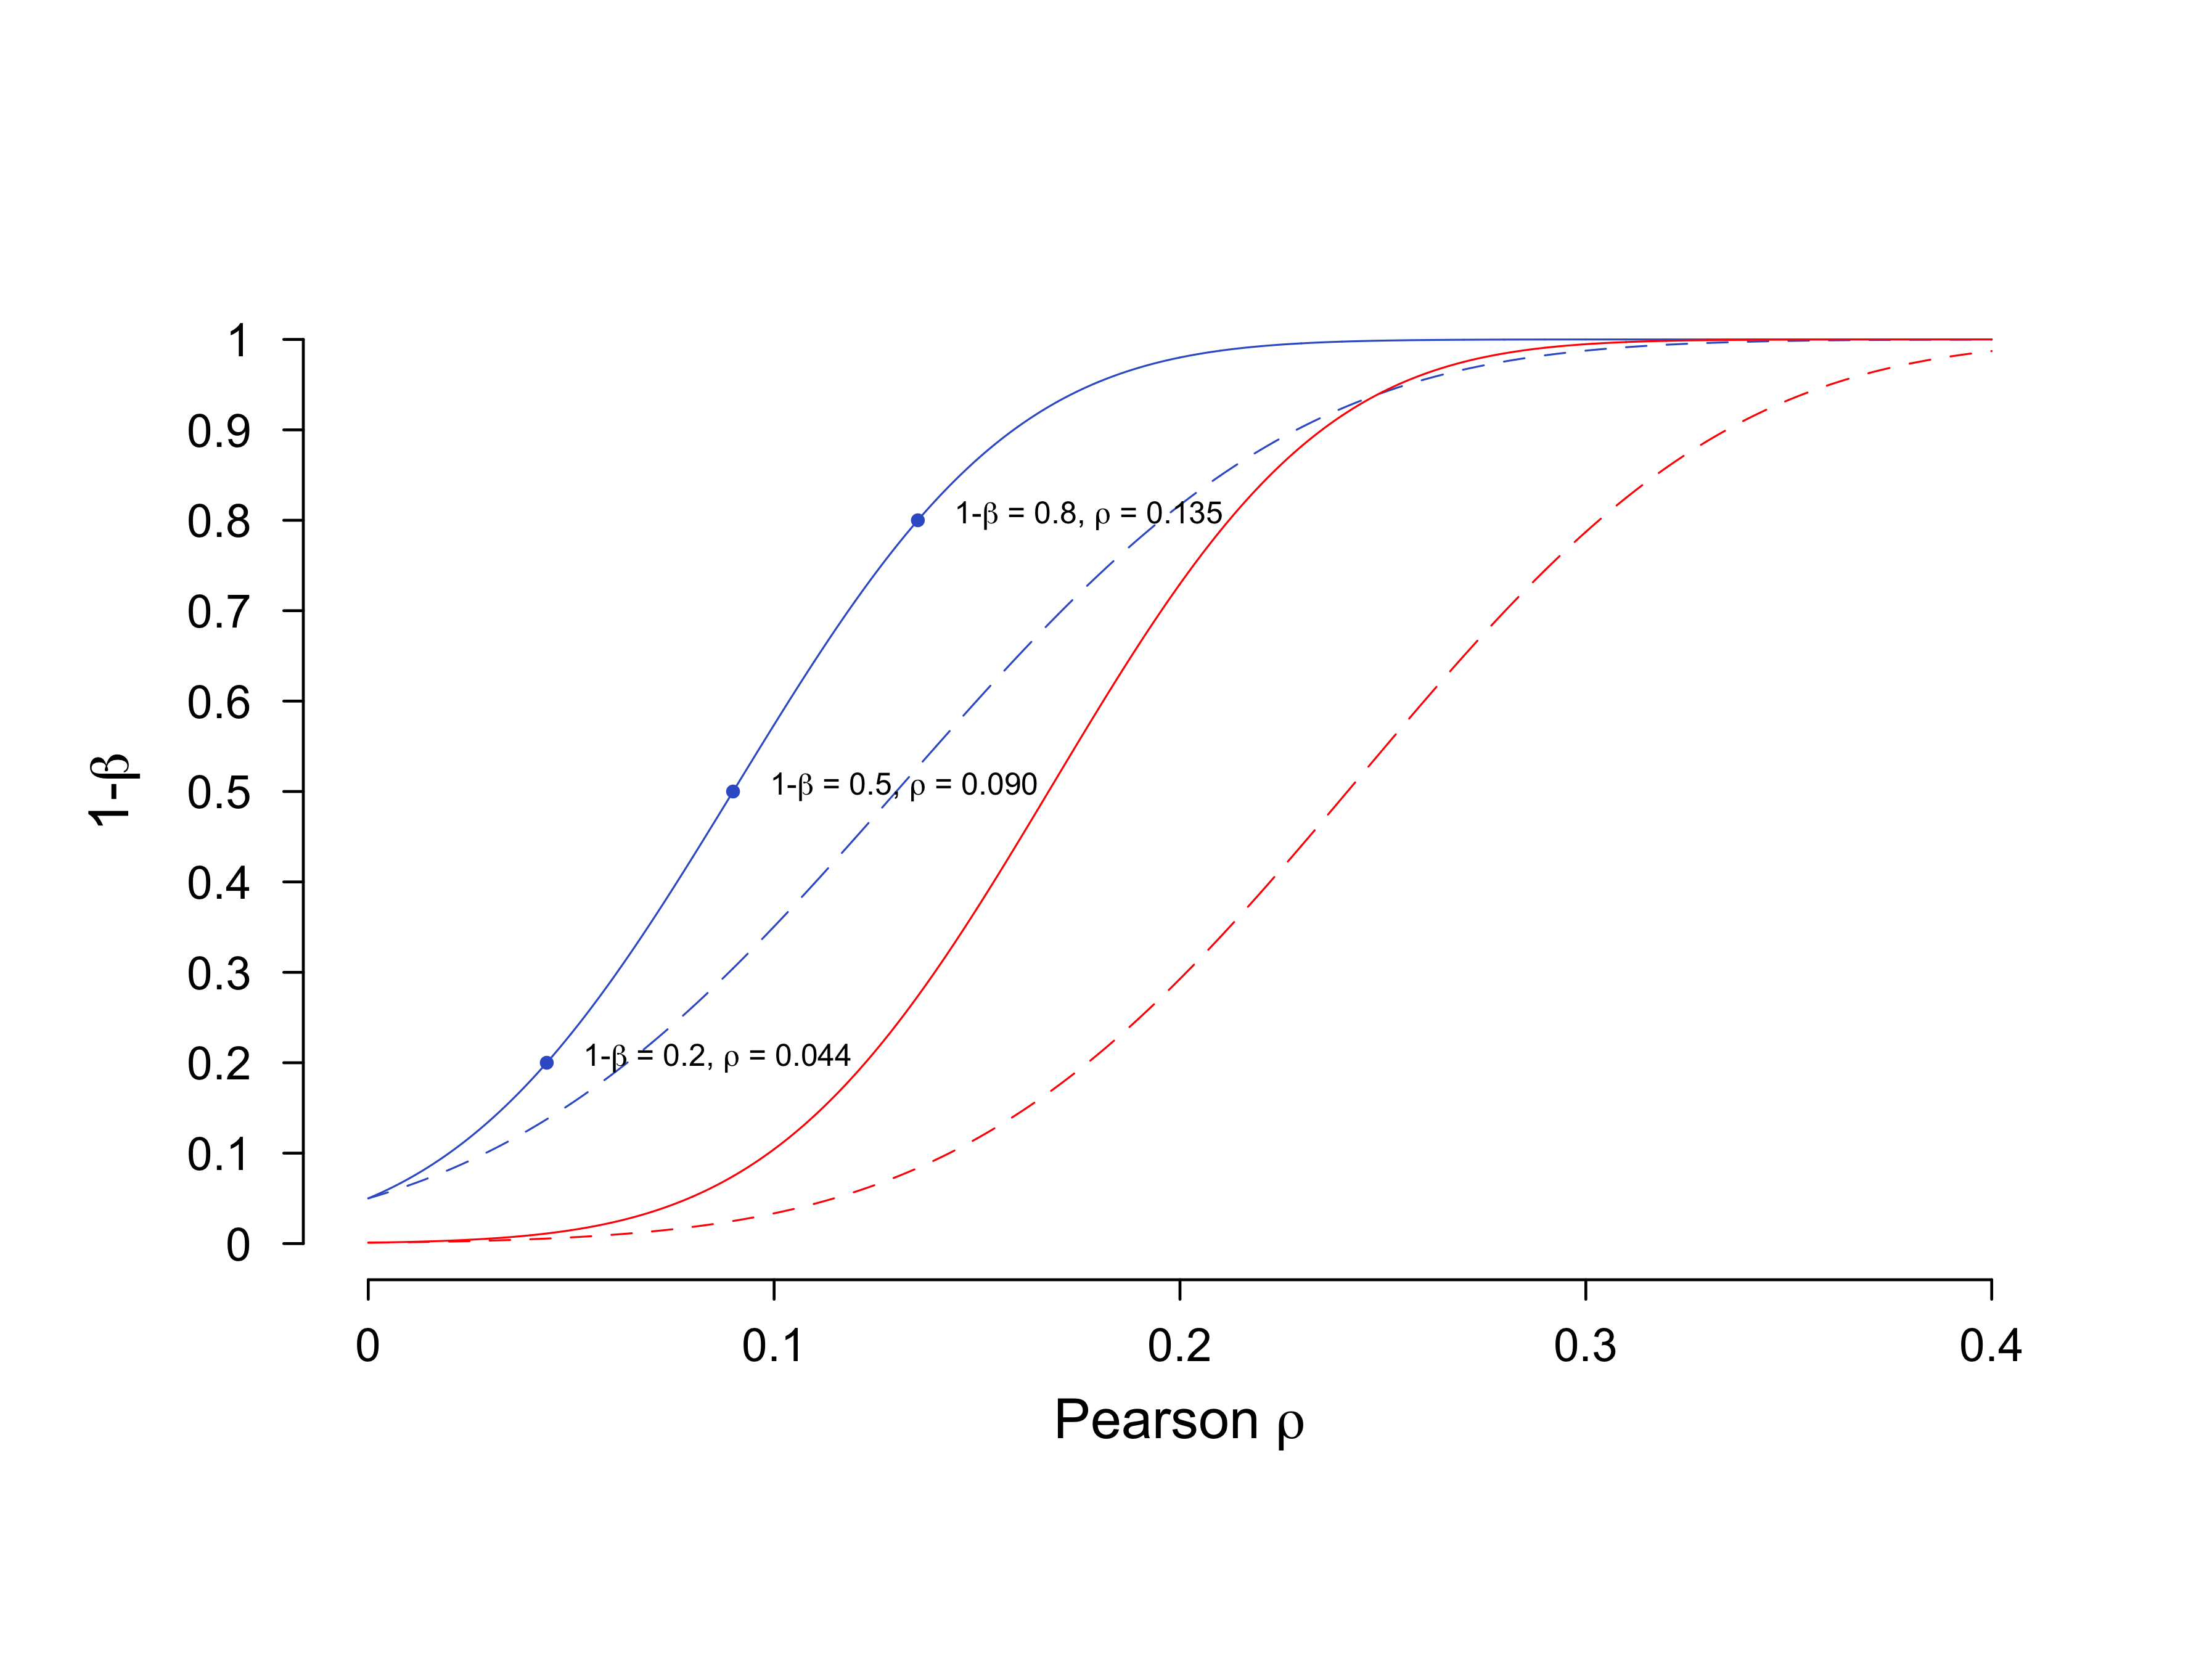
Fig. A1 - Power analysis results (static)
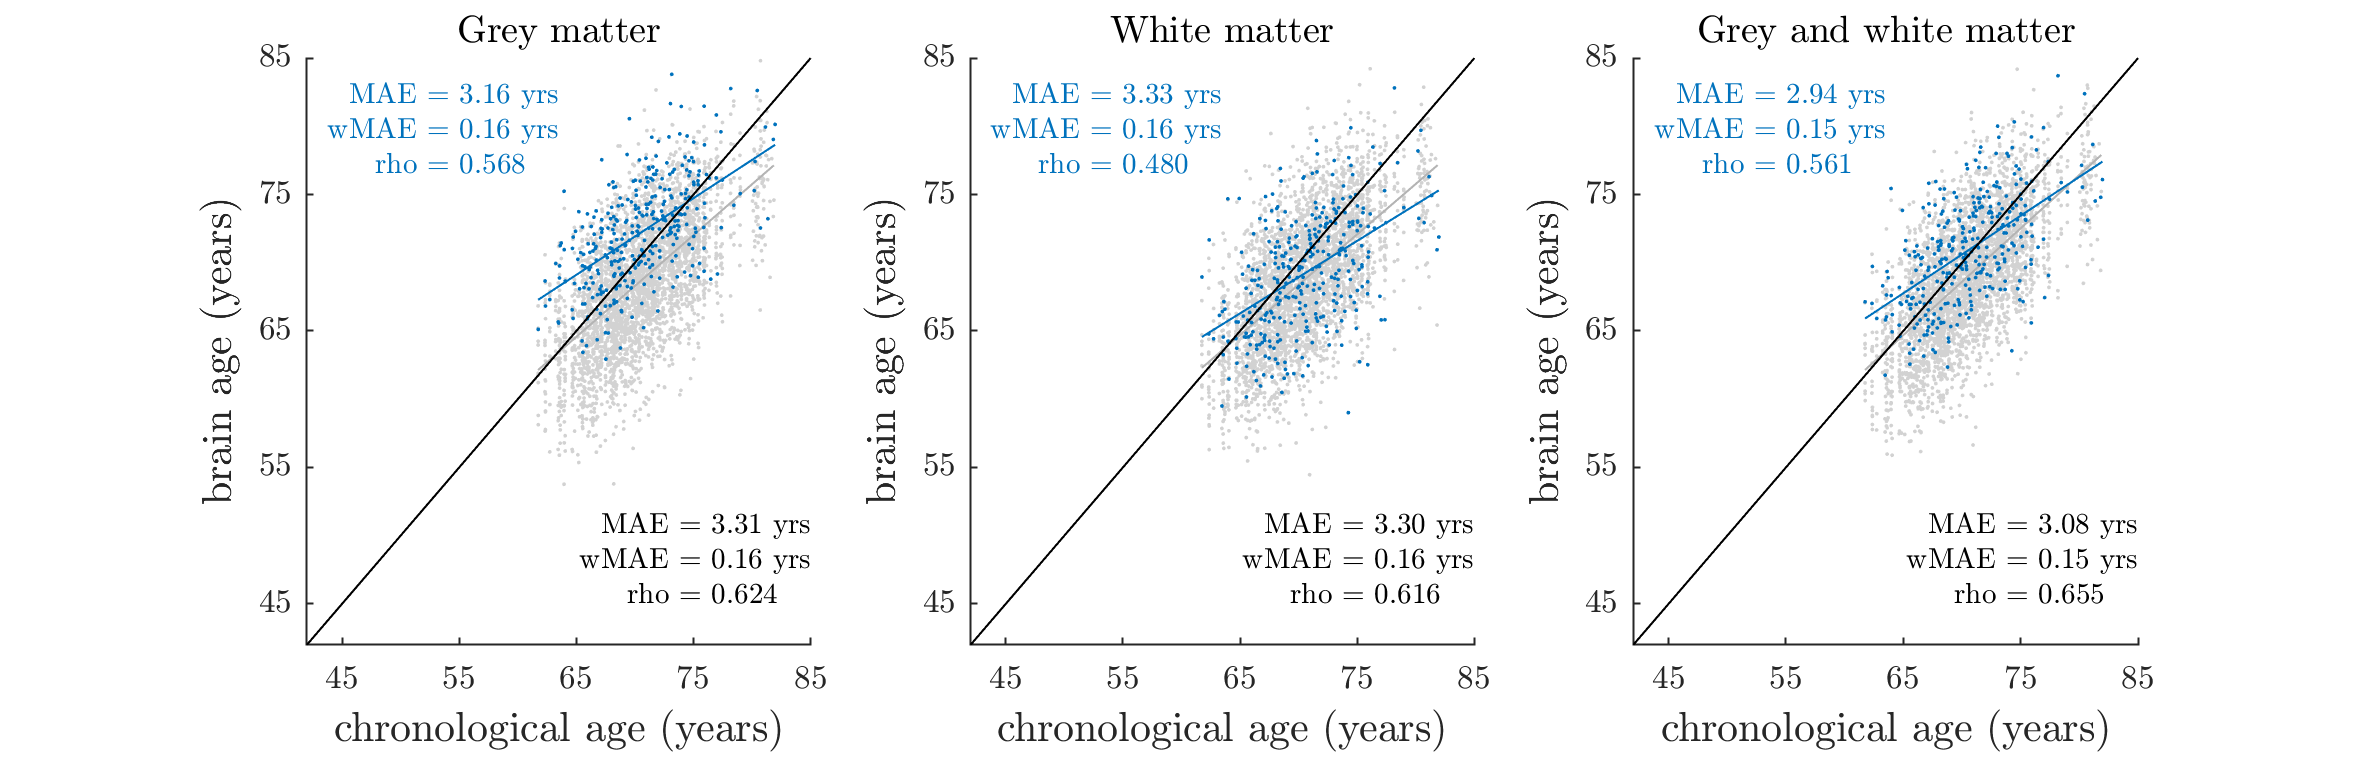
Fig. A2 - Brain-predicted vs. chronological age in BASE-II and matched UKB subset (static)
Fig. A3 - Pearson correlations between 27 outcome variables (interactive)
Fig. A4 - Partial Pearson correlations between 27 outcome variables (interactive)
Fig. A5 - Cluster analysis results of partial Pearson correlations (static)
Fig. A6 - Permutation-based qq-plots showing the distribution of observed vs. expected p-values for all tested associations (static)
Fig. A7 - Partial correlations with age2 vs. without age2 serving as covariate (static)
Fig. A8 - Observed effect sizes vs. literature effect sizes (static)
Fig. 1 - Brain-predicted (‘brain age’) vs. chronological age stratified by sample and tissue class. Blue dots reflect the estimates of the BASE-II sample (N = 335). Grey dots reflect the estimates of the UK Biobank imaging cohort (N = 32,634), among whom age estimation models were trained and applied in a tenfold cross-validation manner. The shown estimates have not been corrected for regression dilution. Prediction accuracy was quantified by MAE (mean absolute error between brain-predicted and chronological age) and rho (Pearson’s correlation coefficient between brain-predicted and chronological age). Please note that due to the different chronological age ranges in BASE-II and UK Biobank, differences in prediction accuracy parameters MAE and rho are an expected finding. Comparison of age prediction accuracies in BASE-II and a matched UK Biobank subset is detailed in supplemental material A (see also suppl. Figure A2.
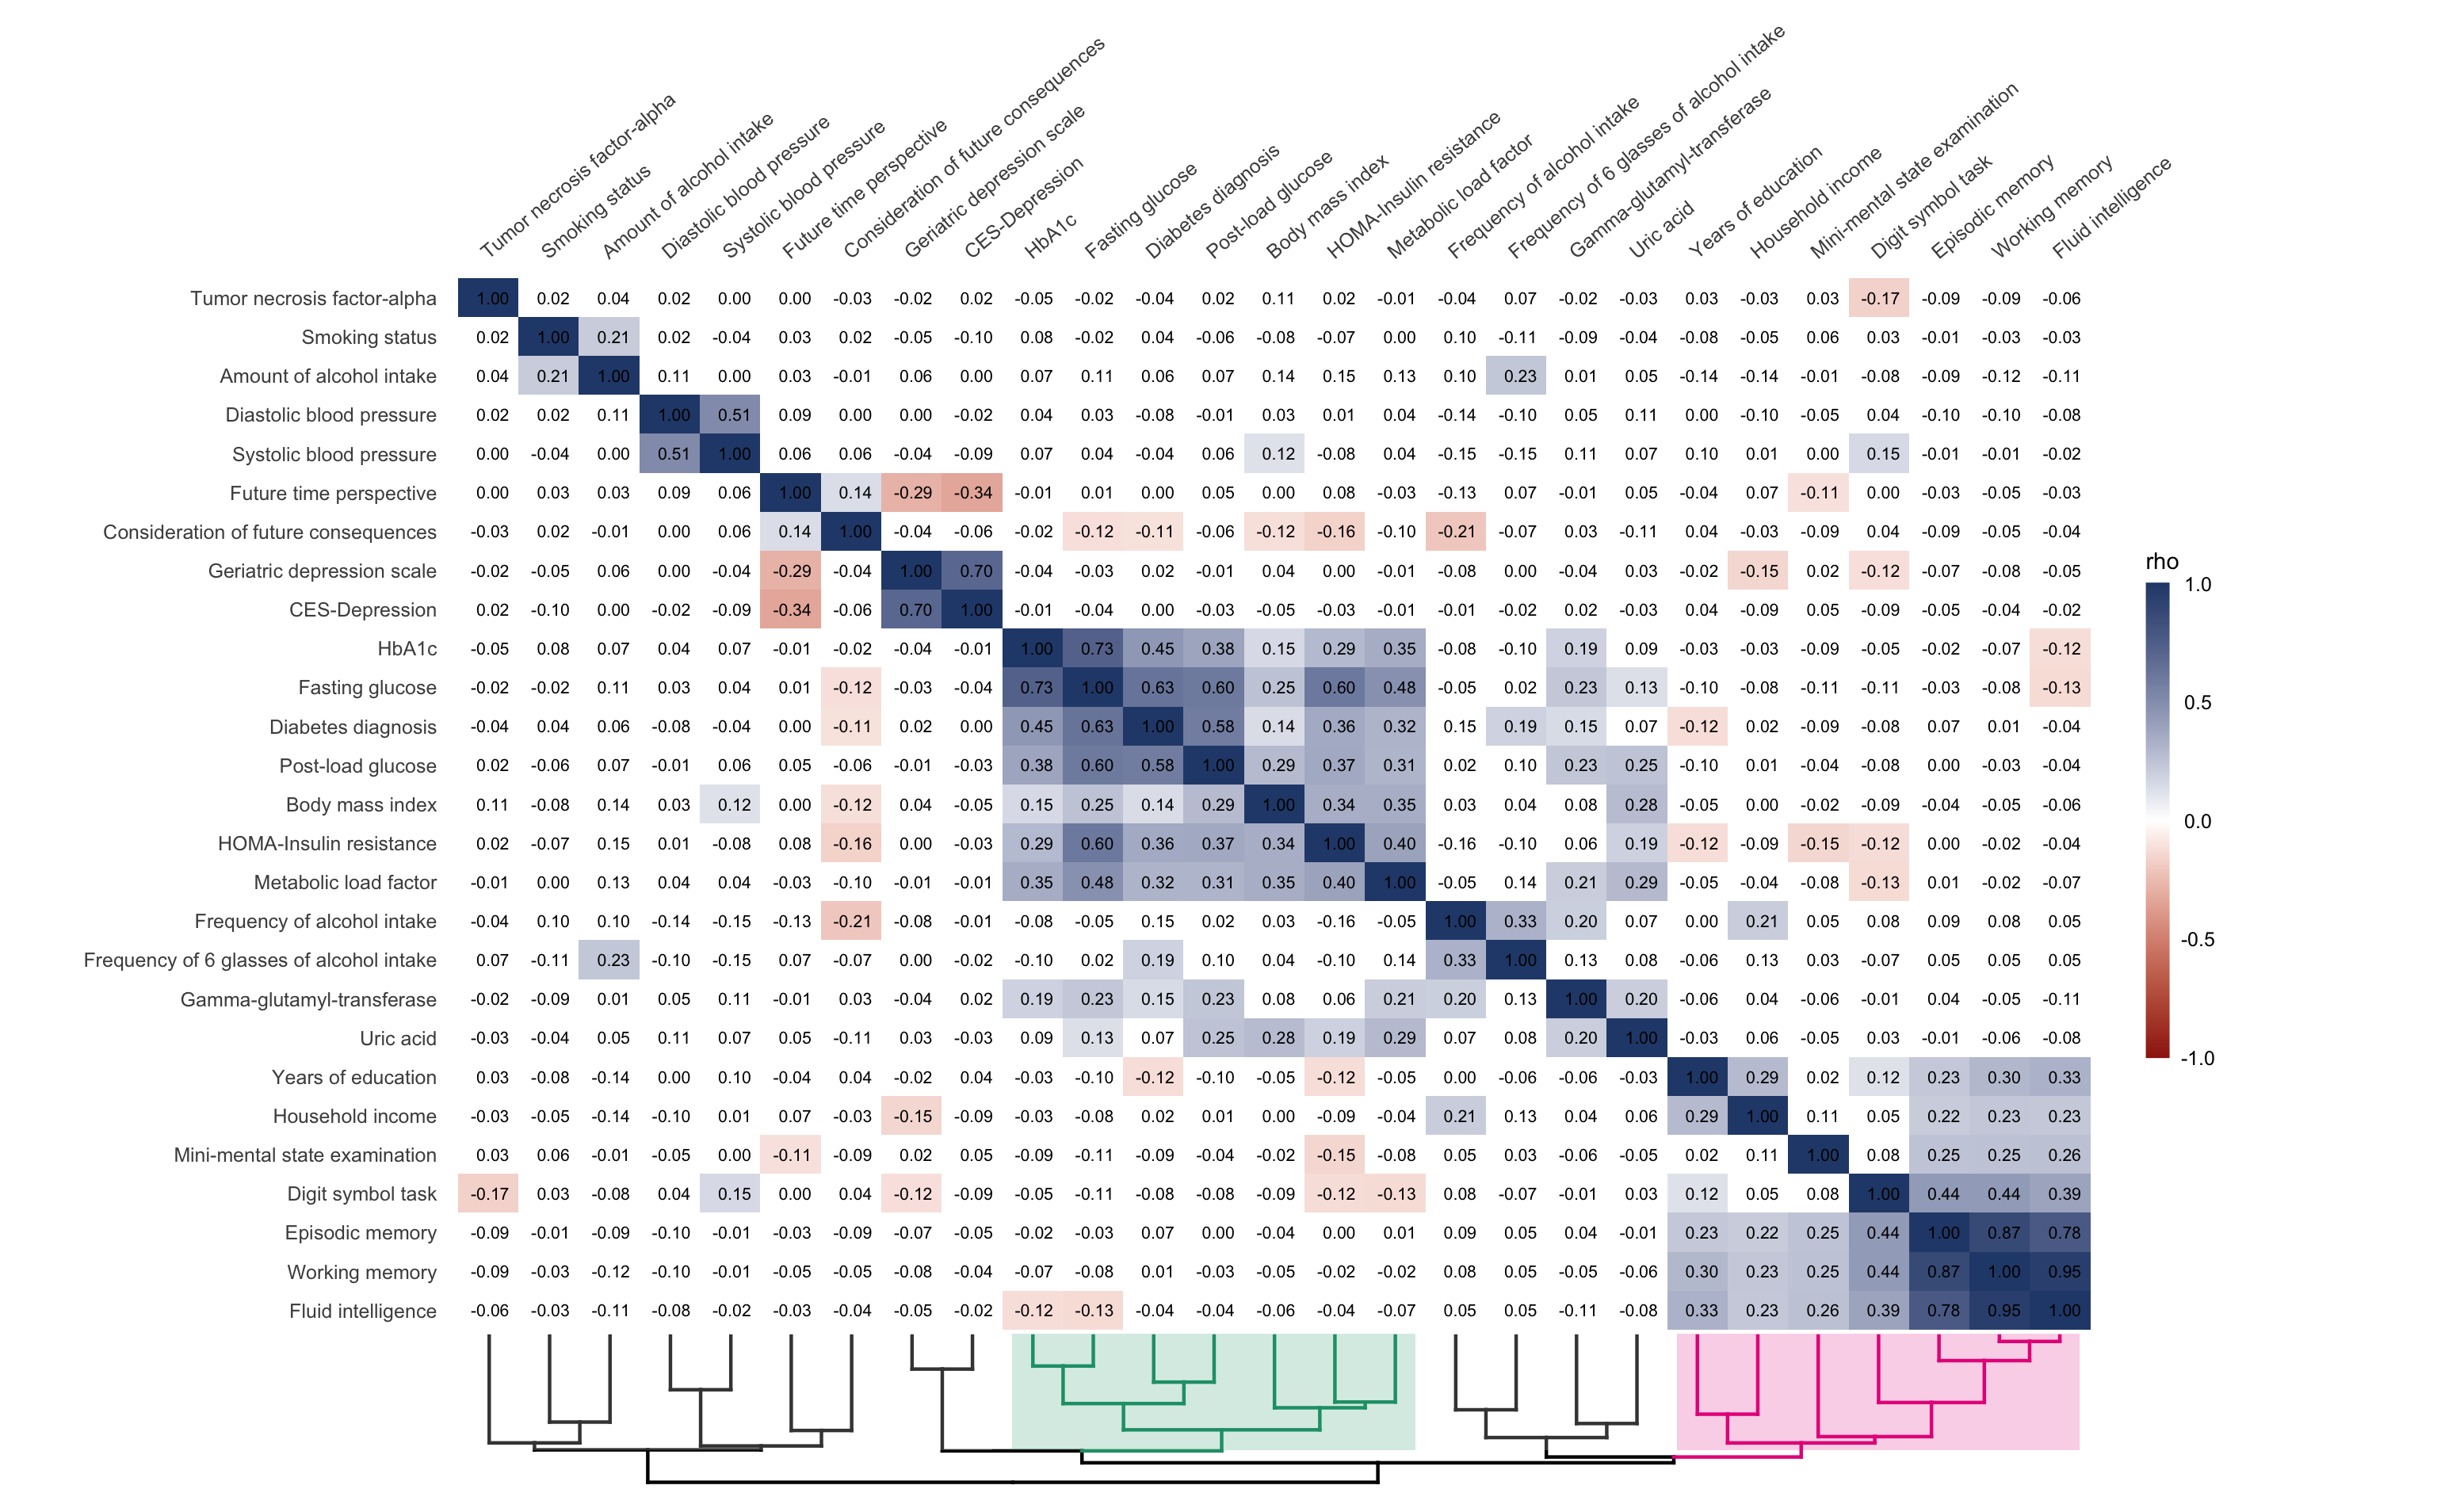
Fig. 2 - Partial Pearson correlations between the 27 outcome variables and grey matter, white matter, and combined grey and white matter brain age gap. Effects of sex, age, age2, and total intracranial volume were partialled out. Only cells containing associations with p < 0.05 (one-tailed) have been assigned with colors of the blue and red color palette. Green cells show associations not reaching nominal significance (p ≥ 0.05) but with hypothesis-consistent effect directions. Note that the number of observations varied across the outcome measures so that stronger associations do not necessarily reflect results with lower p-values. We provide an interactive version of this plot with further details on GitHub. TH: time horizon
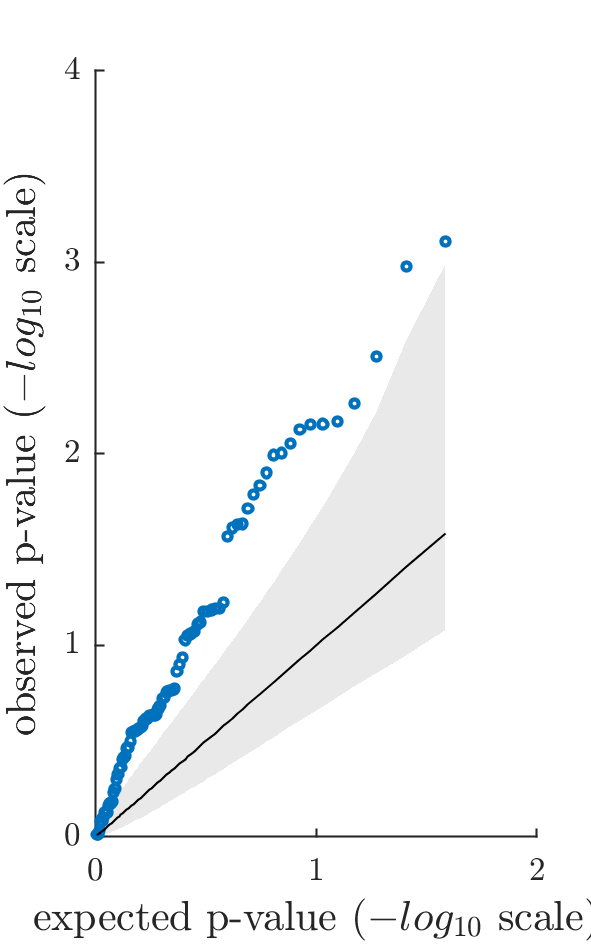
Fig. 3 - Permutation-based quantile-quantile plots showing the distribution of observed p-values from the association analyses (blue circles) sorted from largest to smallest and plotted against the expected p-values under the null hypothesis (1M permutations; one-tailed testing). The solid diagonal line reflects the mean expected p-values ( log10 scale). The lower and upper bound of the grey shaded area represent the 5th and 95th percentile of the expected p-values. The plots show the association results between the 27 outcome variables and grey matter, white matter, and combined grey and white matter brain age gap, respectively. Overall, quantile quantile-plots suggest that association analyses revealed stronger evidence than expected under the null.
Fig. A1 - Power analysis results showing the probability (1-β) of associations to reach the threshold of significance given true effect sizes ranging between ρ = 0.0 and ρ = 0.4. The blue curves show the probabilities of effects to reach nominal significance (α = 0.05, one-tailed) with n = 335 (solid curve) and n = 160 participants (dashed curve). The red curves show the probabilities of effects to reach the level of significance after multiple-testing correction (α = 0.001, one-tailed) with n = 335 (solid curve) and n = 160 participants (dashed curve). Power analysis was carried out using R package pwr v1.3-0 (Champely, 2020).
Fig. A2 - Brain-predicted (‘brain age’) vs. chronological age stratified by sample and tissue class. Blue dots reflect the estimates derived from the BASE-II sample (N = 335). Grey dots reflect the estimates derived from the age- and sex-matched UK Biobank subset (N = 3,350), among whom age estimation models were trained and applied in a tenfold cross-validation manner. The shown estimates have not been corrected for regression dilution. Prediction accuracy was quantified by MAE (mean absolute error between brain-predicted and chronological age) and rho (Pearson’s correlation coefficient between brain-predicted and chronological age).
Fig. A3 - Pearson correlations between the 27 outcome variables. Only cells with correlations reaching nominal significance (p < 0.05) have been assigned with colors of the blue and red color palette.
Fig. A4 - Partial Pearson correlations between the 27 outcome variables. Sex, age, age2, and total intracranial volume served as covariates. Only cells with correlations reaching nominal significance (p < 0.05) have been assigned with colors of the blue and red color palette.
Fig. A5 - Partial Pearson correlations between the 27 criterion variables (same results as shown in Fig. A4) hierarchically clustered using R function hclust with agglomeration method ‘complete’. Cluster analysis revealed two higher order clusters with significant intercorrelations. Green: Cluster of diabetes and metabolic syndrome related variables, Violet: Cluster of socioeconomic and cognitive performance variables.
Fig. A6 - Permutation-based quantile-quantile plot showing the distribution of observed p-values from the association analyses (blue circles) sorted from largest to smallest and plotted against the expected p-values under the null hypothesis (1M permutations; one-tailed testing). The solid diagonal line reflects the mean expected p-values ( log10 scale). The lower and upper bound of the grey shaded area represent the 5th and 95th percentile of the expected p-values. The plot shows results of 81 tested associations (3 brain age gap variables by 27 outcome variables). Overall, the quantile quantile-plots suggest that association analyses revealed stronger evidence than expected under the null.
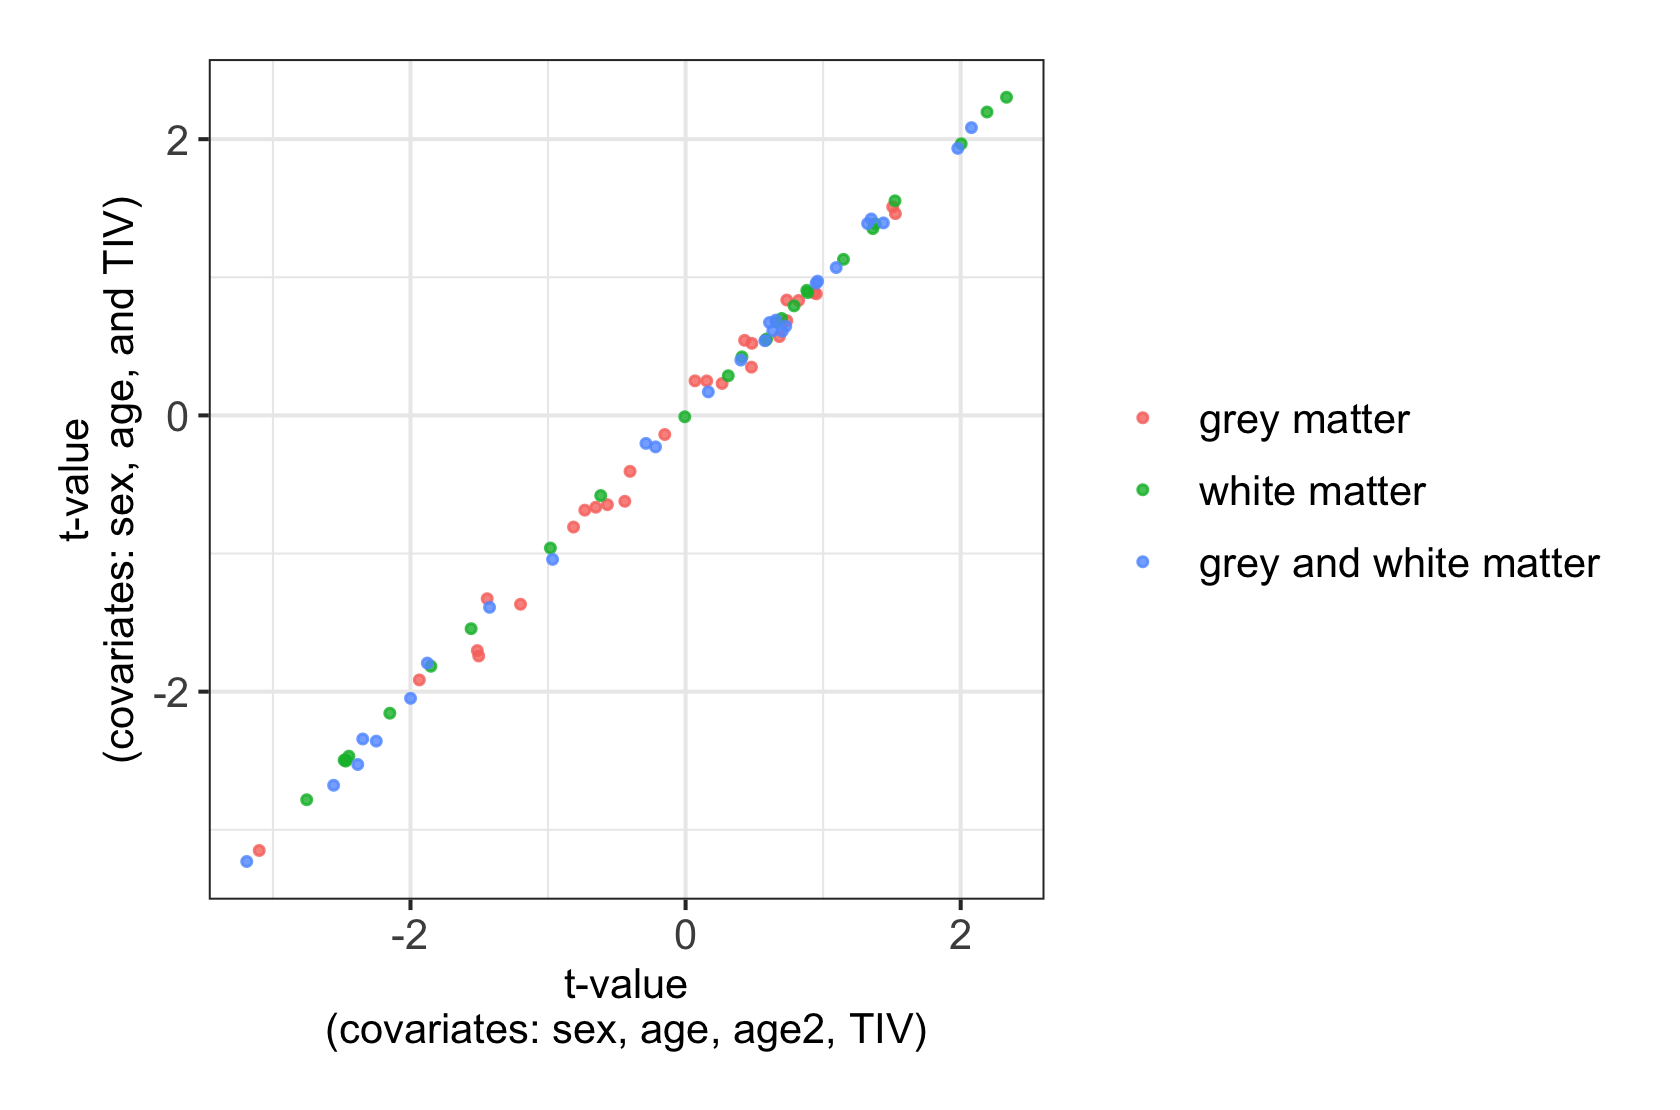
Fig. A7 - Comparison of partial Pearson correlation results (t values) with age2 serving as covariate (x-axis) vs. without age2 serving as covariate (y axis). Correlations were calculated between brain age gap variables (grey matter, white matter, and combined grey and white matter) and the 27 criterion variables. The plot indicates that association results were not substantially altered by partialling out effects of age2. TIV: total intracranial volume.
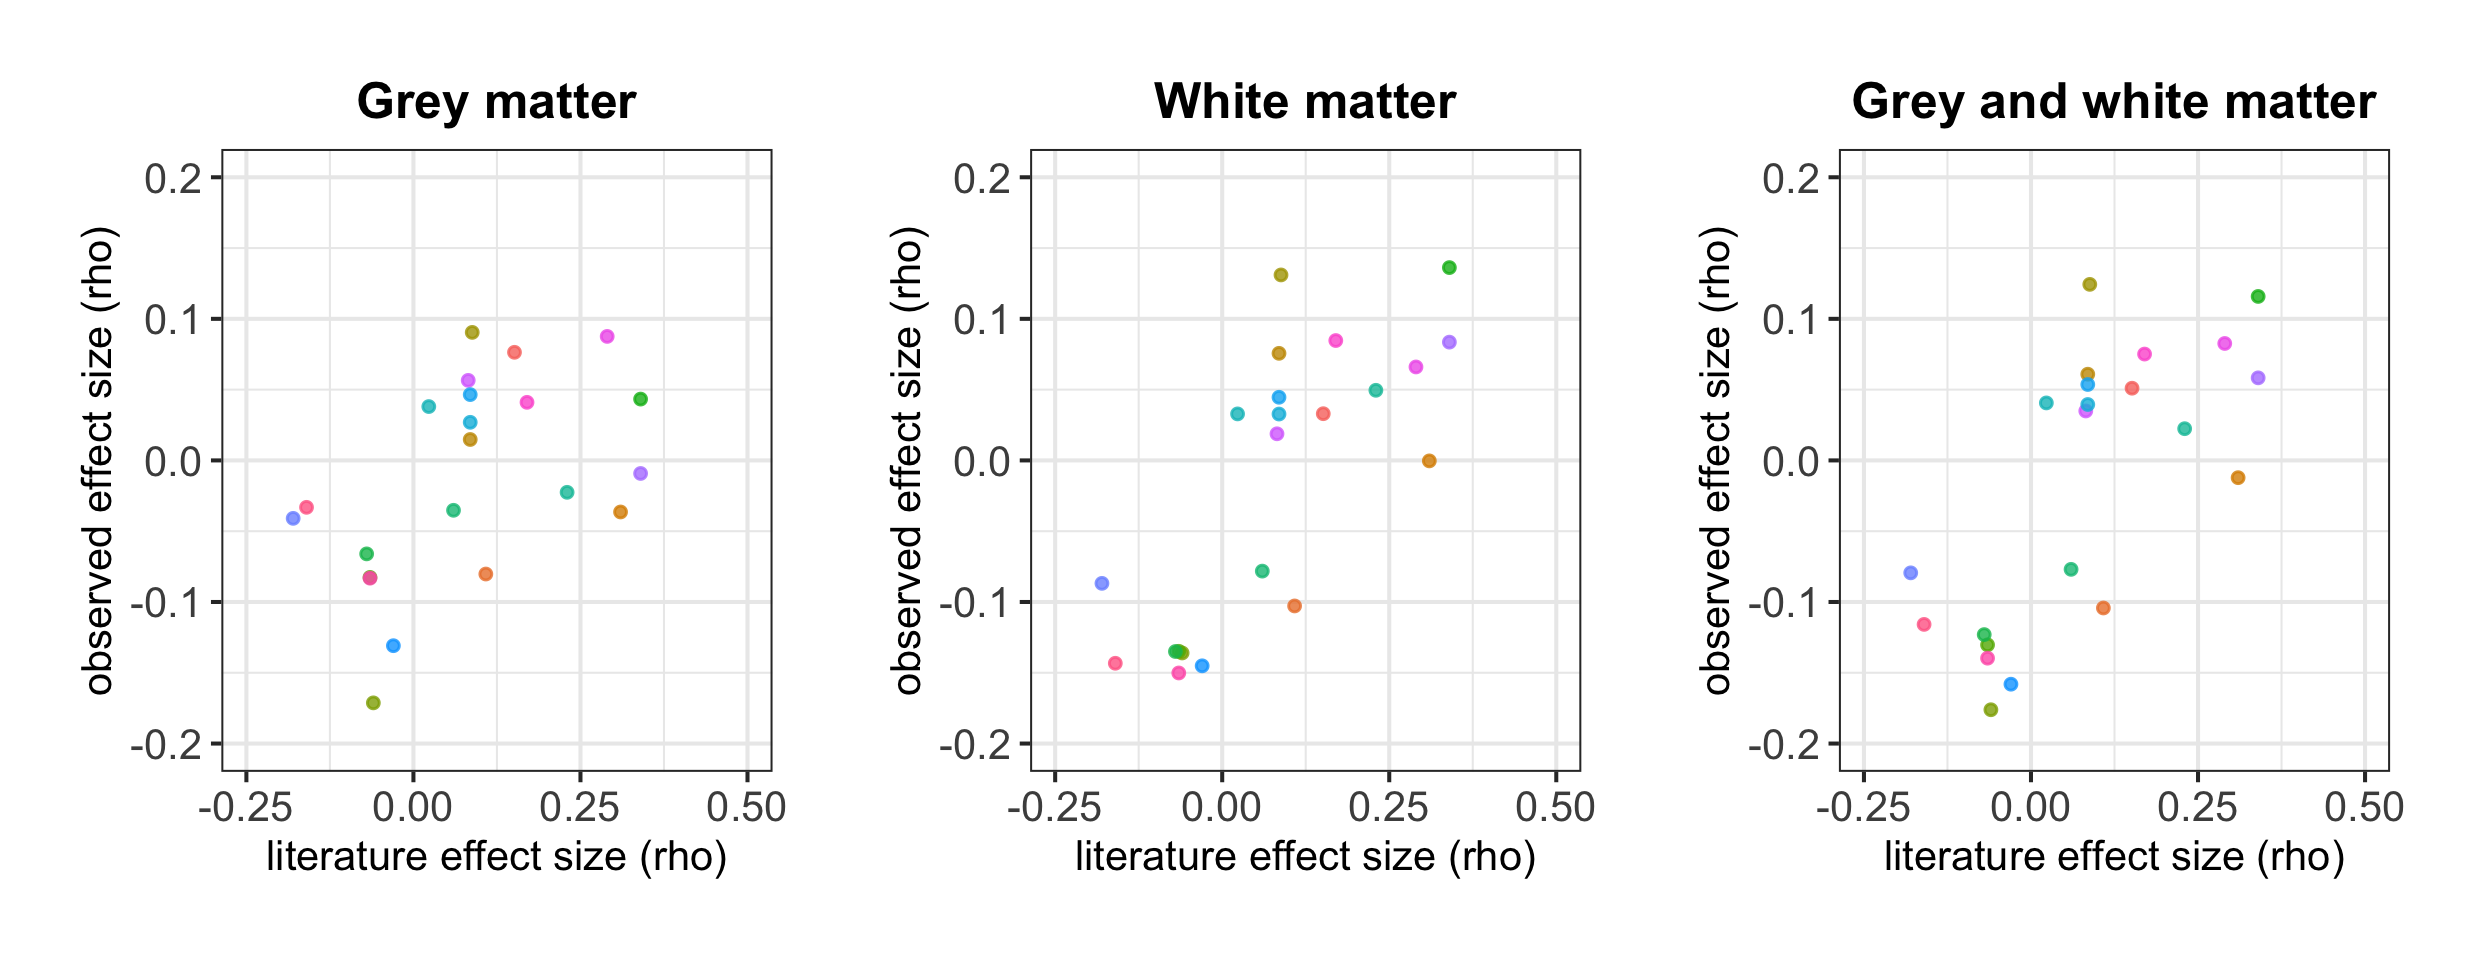
Fig. A8 - Effect sizes of criterion variables observed in the present study (y-axis) plotted against respective effect sizes reported in the previous literature (x-axis; see suppl. Table B1 for details). If multiple literature effect sizes were available for a single criterion variable, the median effect size was calculated. The plots indicate a noticeable degree of consistency between the observed vs. literature effect sizes and directions, respectively. Overall, plots suggest a lower range of observed effect sizes when compared to effect sizes reported in the previous literature, i.e., effect sizes tended to be smaller in the present study.