Software for data-driven interactive analysis of epidemic transitions
remotes::install_github("project-aero/AEROnaut")spaero(R package, github, developement version) by Eamon O’Deatycho2(R package, github) - Interface to Tycho2 API (see Tycho2.Rmd) by Éric Martydatacolor(R package, github) - color palettes for data visualization by Éric Marty
See DESCRIPTION for compelte list of dependencies
IMPORTANT: This release depends on the “tdar” branch of the development
version of spaero
remotes::install_github("e3bo/spaero@tdar")This package will not be ready for CRAN until all dependencies are on CRAN.
- High Level interface to POMP w or w/o GUI
- age, space
- determ, fast stoch, slow stoch, real data, fake based on real data?
- input template of individual reactions
- metapopulation templates
- Explaining EWS to funding agency
- Instruction app on how EWS work
- compare w/ other models, and real data, fake base don real data
- relationship bet. EWS and model params
- integrate preformance: AUC, kendall’s tau
- to guage interest at MIDAS meeting
- Optimizing EWS (data interogation and analysis)
- for analyst usage
- trend / residuals to verify detrending
- detrending model (start on linear within window)
- bandwidth optimization
- incorporate cumulative Kendalls’ Tau with significance test
- use outside our group?
- menu of things (tasks etc.) to choose from.
- no need to think in terms of “tabs”. Other metaphore may be better.
- vignettes or html to present workflows. (Model how a user might explore questions.)
- include Shiny app in package AND host on a Shiny server
(see https://deanattali.com/2015/04/21/r-package-shiny-app/)
(example: https://daattali.com/shiny/timevis-demo/)
-
Trend, residuals
-
MW Moments
-
Variance convexity (Miller et al. 2017) synonymous with variance first diff.
-
TDAR (now rolled into
e3bo/spaero@tdaron github) -
MW Kendall’s taus of all of the above
-
[…] Cox’s delta (moving window)
-
Autocorrelation function (ACF) at multiple lags
-
[…] CWT Spectrogram / Scaleogram (bias corrected)
-
[…] CWT Spectrogram / Scaleogram (bias corrected), normalized by variance
-
[…] CWT Spectrogram / Scaleogram (bias corrected), normalized 0-1
-
CWT Peak tracking (Eamon has code for this)
-
[…] Spectral Power (a.k.a. “Wavelet filtered reddening” (Miller et al. 2017)) (\bar{W}^2_{t,j_1,j_2})
-
[…] Spectral Median (a.k.a. “Wavelet spectral reddening” (Miller et al. 2017))
-
Spectral centroid (weighted mean of the frequencies)
({\displaystyle \mathrm {Centroid} ={\frac {\sum _{n=0}^{N-1}f(n)x(n)}{\sum _{n=0}^{N-1}x(n)}}})
-
Spectral Rolloff - a generalization of spectral median, with arbitrary cutoff, i.e. 85%
-
Spectral slope (or spectral gradient) - slope of line of best fit through spectral data (linear regression).
Increasingly negative slopes indicate reddening.
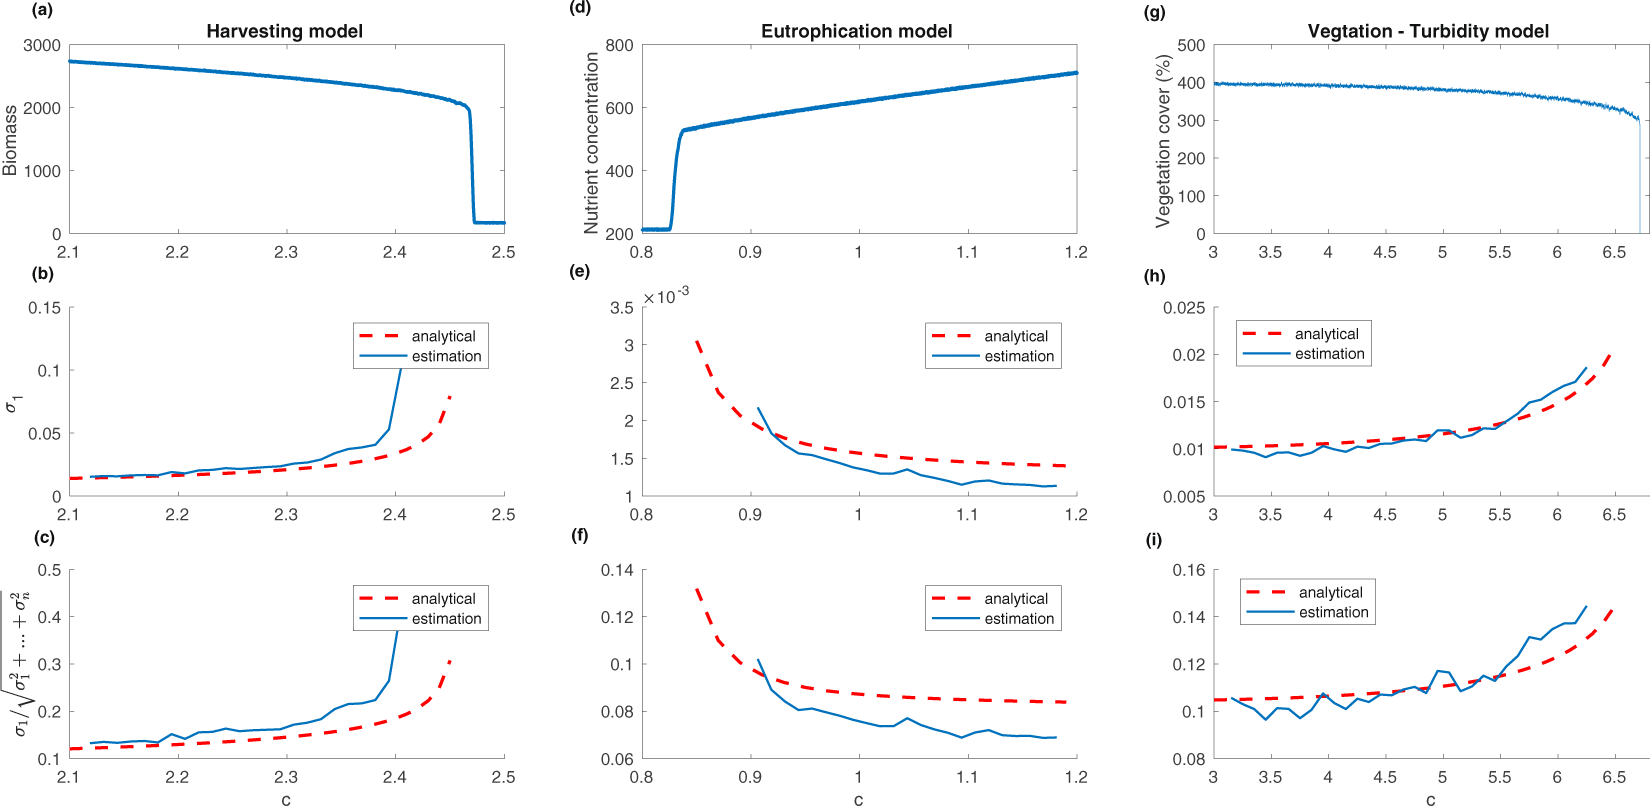
- Eigenvalues of the covariance matrix (Chen et
al. 2019)
- largest eigenvalue of the covariance matrix
$\sigma_1$ - percentage of variation due to largest eigenvalue of the
covariance
matrix
$$\frac{\sigma_1}{\sqrt{\sigma_1^2+\dots+\sigma_n^2}}$$
- largest eigenvalue of the covariance matrix
-
Eamon investigating Chen et al EWS applies to non-spatial multivariate timeseries (e.g. age structured)
-
Spatial early warning signals (e.g. spatial correlation) (Gray and Drake 2014)
- Spatial autocorrelation
- Spatial skewness
earlywarningsandspatialwarningsR packages
-
coherence of wavelets (Amin) - preliminary research in progress
- rolling P-values of rolling taus (in progress)
- high D stuff (toby)
- AUC - for paricular signal, EWS, does over a selected range the AUC have a high value?
- separate transmission from reporting
- markers & annotations (provide sets of annotaions to overlay on graphs)
- dashboard launcher in a shiny interface
-
present prototype of Data Dashboard at MIDAS (May, 2019)
Presentation archived atproject-aero/AEROnaut-MIDAS2019. -
internal release as R package (includes plotly dashboard) (September 11, 2019)
remotes::install_github("project-aero/AEROnaut")
-
internal release as package version with embedded shiny app (Fall 2019)
-
write vignettes (Fall 2019) (in progress)
-
public release of R package (includes embedded shiny app) (Spring 2019)
-
submit to CRAN (Spring 2019)
-
Deploy on shiny server (TBD)
-
release as a downloadable toolkit in some alternate form (HTML, notebook?) not requiring user to know R/Rstudio. (Future Date?)
Main Funtions
analyze() runs spaero::get_stats() on a time series using a grid of
parameters and outputs results in a nested tibble.
crunch() runs analyze(), then pre-calculates plotly plot objects
using the results. The analyses tibble, plot objects, and metadata are
output in a list. The output of crunch() is typically stored in a
named object for later retrieval.
dashboard() takes the output of crunch() and displays a customizable
Plotly dashboard.
launch() runs named Shiny Apps included with AEROnaut package.
Currently, only Spencer’s Legacy app is included.
Data Retrieval Funtions
getCDCdata() Retrieve data from https://data.cdc.gov
tycho2::tycho2() Retrieve data from http://tycho.pitt.edu
Details: vignette("data", package = "AEROnaut")
Epidemic Calendar Operations
epicalendar() Build calendar from CDC or ISO epidemiological year(s)
and week(s)
epidate() Calculate dates from CDC or ISO epidemiological year(s) and
week(s)
years_with_53() Report which epidemiological years have 53 weeks
has_53_weeks() Report whether or not given epidemiological year(s)
have 53 weeks
roundweekday() Round a date to the nearest specified weekday
Details: vignette("calendar", package = "AEROnaut")
Example time series
- sim_reports.cases.Rdata (simulated cases under imperfect reporting from Brett et al. 2018)
Example “crunched” data objects containing timeseries, precaculated stats and subplots
- CDC_measles.RData (Measles in the US since 2014)
- measles_CA.RData (Measles in CA, 1990 outbreak)
- measles_US.RData (Measles in the US, 1990 outbreak)
- pertussis_CA.RData (Pertussis in CA, 1970-1983)
- pertussis_TX.RData (Pertussis in TX, showing no criticial slowing down)
- sim_reports.RData (crunched simulated cases, imperfect reporting, Brett et al. 2018)
Other
TBD
R Markdown vignettes for various tasks and workflows:
Data Retrieval data.Rmd vignette("data", package = "AEROnaut")
Calendar Operations calendar.Rmd vignette("calendar", package = "AEROnaut")
More to come…
Shiny apps to come…
Shiny apps are stored in inst/Shiny/
The legacy Shiny-based application coded by Spencer. Archived here for reference. To run the application, use:
AERONAUT::launch("legacy")This can be run from any directory. This is equivalent to running
shinyAppDir("legacy") from the shiny/ directory inside the
AEROnaut package directory.
The new app(s) will use Shiny and Plotly for interactivity.
Currently, we are prototyping components of the final app in individual R scripts, Rmd and/or vignettes. We have yet to determine the structure of the final app(s).
Components will include Data Dashboard for analyzing real data, a Simulation Interface, a Data Retrieval intercace. and other components TBD.
1. Data Dashboard
Elements:
- plots
- interactive legend
- lines colored by params grid (bw)
- grid of EWS for multiple BW.
- integrated display of taus, significance
- parametrization:
- EWS params grid definition (bandwidth, kernel)
- significance penalty option ?
- EWS to display
- EWS metadata to display
- ?
2. Simulation Interface
To be added. Will be a high-level interface to pomp/spaero.
3. Data Retrieval Interface
To be added. High level interface to tyccho2, soractes and other APIs, as well as any datasets we decide to package with AUROnaut.
- tycho2 package for Project Tycho data
- RSocrata package for CDC data
- others?
Gray, D.G. & J.M. Drake (2014). “Quantifying the performance of spatial and temporal early warning signals of disease elimination.” Population Biology of Infectious Diseases REU Site at UGA
Chen, S., et al (2019). “Eigenvalues of the covariance matrix as early warning signals for critical transitions in ecological systems.” Scientific Reports. https://doi.org/10.1038/s41598-019-38961-5
Miller, P. B., O’Dea, E. B., Rohani, P., & Drake, J. M. (2017). “Forecasting infectious disease emergence subject to seasonal forcing.” Theoretical Biology and Medical Modelling, 14(1). https://doi.org/10.1186/s12976-017-0063-8
Brett, T.S., E.B. O’Dea, É. Marty, P.B. Miller, A.W. Park, J.M. Drake & P. Rohani (2018) “Anticipating epidemic transitions with imperfect data.” PLoS Computational Biology. https://doi.org/10.1371/journal.pcbi.1006204
Brett, T.S., J.M. Drake & P. Rohani (2017). “Anticipating the emergence of infectious diseases.” Journal of the Royal Society Interface. http://dx.doi.org/10.1098/rsif.2017.0115
O’Regan, S. M., J.W. Lillie & J.M. Drake (2016). “Leading indicators of mosquito-borne disease elimination.” Theoretical Ecology. http://dx.doi.org/10.1007/s12080-015-0285-5
O’Dea, E.B., J.M. Drake (2018). “Disentangling Reporting and Disease Transmission.” Theoretical Ecology. https://doi.org/10.1007/s12080-018-0390-3
Dibble, C.J., E.B. O’Dea, A.W. Park & J.M. Drake (2016). “Waiting time to infectious disease emergence.” Journal of the Royal Society Interface. http://dx.doi.org/10.1098/rsif.2016.0540
O’Dea, E.B., A.W. Park, J.M. Drake (2018). “Estimating the distance to
an epidemic threshold.”
Journal of the Royal Society Interface.
https://doi.org/10.1098/rsif.2018.0034
https://daphnia.ecology.uga.edu/midas/
John DrakeUGA, Andrew ParkUGA, Matt FerrariPSU, Pej RohaniUGA, Bogdan EpureanuUM, Suzanne O’ReganNCATSU, Toby BrettUGA, Eamon O’DeaUGA, Andrew TredennickUGA, Amalie McKeePSU, Chris DibbleUGA, Shiyang ChenUM, Paige MillerUGA, Éric MartyUGA, Spencer HallUGA
UGA: University of Georgia, PSU: Pennsylvania State University, UM: University of Michigan, NCATSU: North Carolina A&T State University
https://www.nigms.nih.gov/Research/SpecificAreas/MIDAS

Research reported here was supported by the National Institute Of General Medical Sciences of the National Institutes of Health under Award Number U01GM110744. The content is solely the responsibility of the authors and does not necessarily reflect the official views of the National Institutes of Health.