

See your agent think. Real-time observability for OpenClaw AI agents.
One command. Zero config. Auto-detects everything.
pip install clawmetry && clawmetryOpens at http://localhost:8900 and you're done.
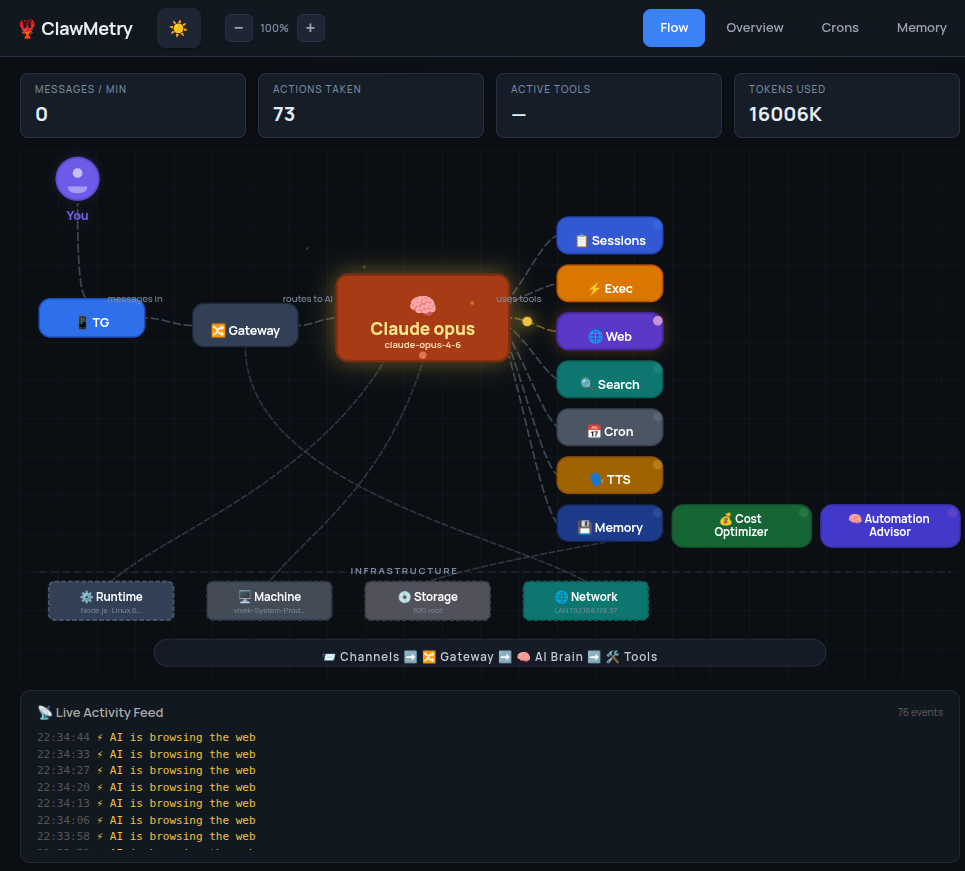
- Flow — Live animated diagram showing messages flowing through channels, brain, tools, and back
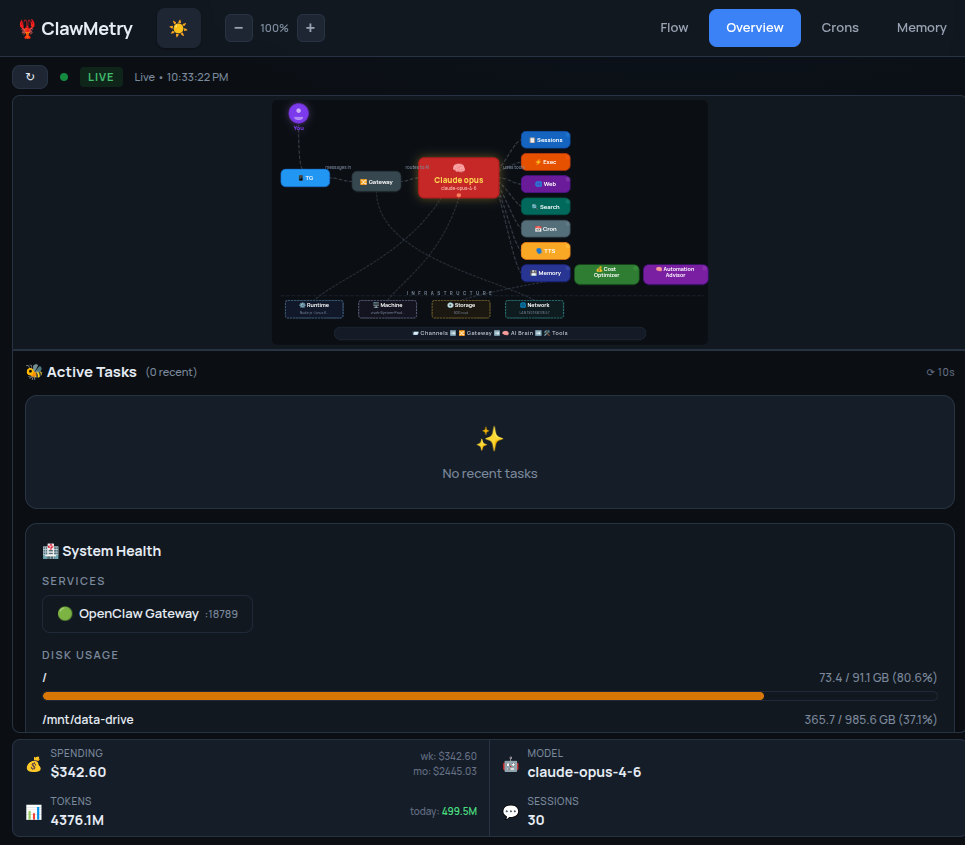
- Overview — Health checks, activity heatmap, session counts, model info
- Usage — Token and cost tracking with daily/weekly/monthly breakdowns
- Sessions — Active agent sessions with model, tokens, last activity
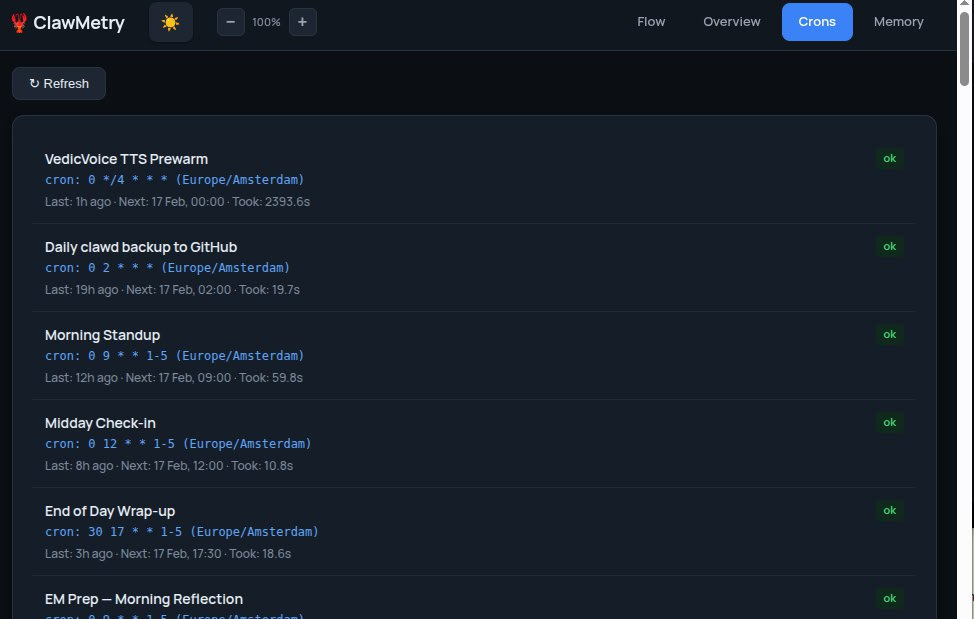
- Crons — Scheduled jobs with status, next run, duration
- Logs — Color-coded real-time log streaming
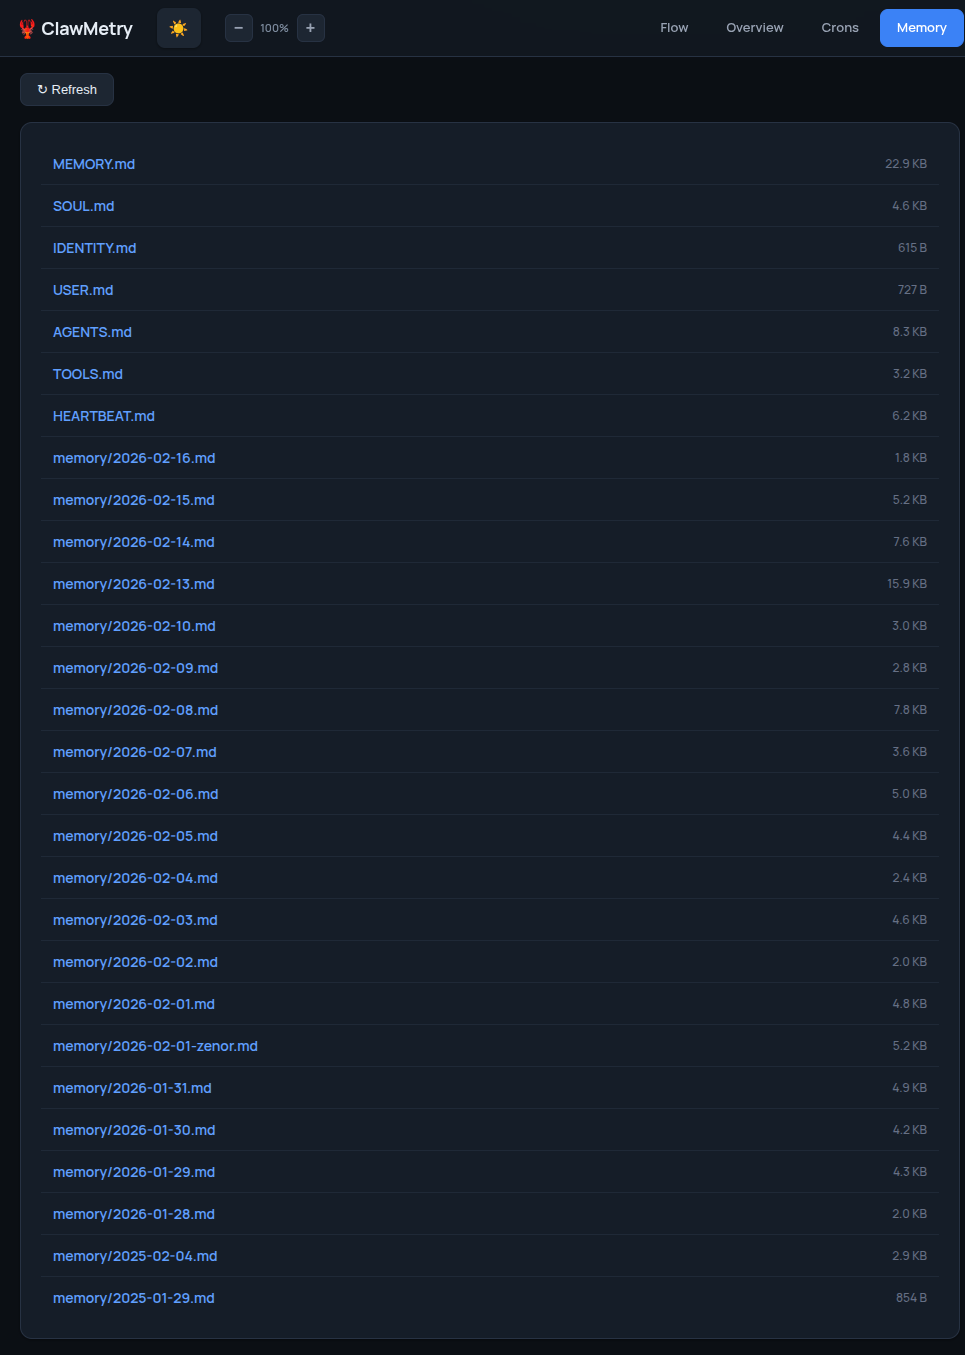
- Memory — Browse SOUL.md, MEMORY.md, AGENTS.md, daily notes
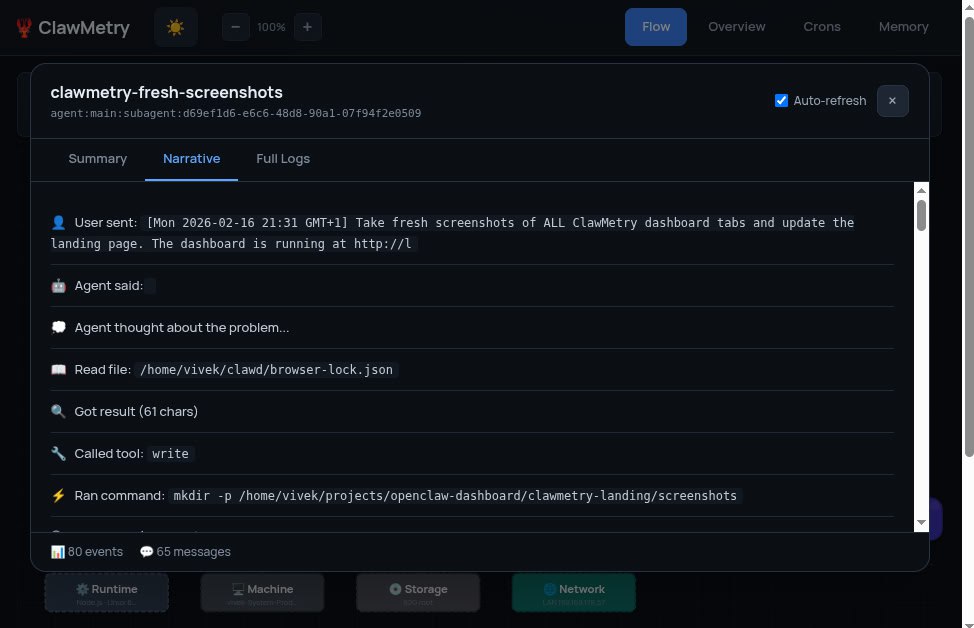
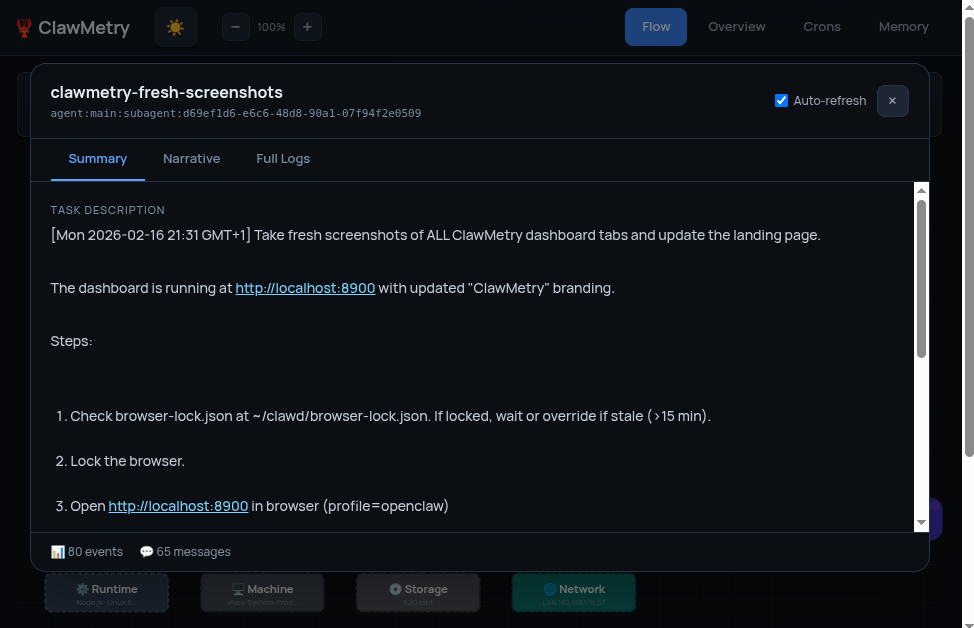
- Transcripts — Chat-bubble UI for reading session histories
| Flow | Overview | Sub-Agent |
|---|---|---|
 |
 |
 |
| Summary | Crons | Memory |
|---|---|---|
 |
 |
 |
pip (recommended):
pip install clawmetry
clawmetry
One-liner:
curl -sSL https://raw.githubusercontent.com/vivekchand/clawmetry/main/install.sh | bashFrom source:
git clone https://github.com/vivekchand/clawmetry.git
cd clawmetry && pip install flask && python3 dashboard.pyMost people don't need any config. ClawMetry auto-detects your workspace, logs, sessions, and crons.
If you do need to customize:
clawmetry --port 9000              # Custom port (default: 8900)
clawmetry --host 127.0.0.1         # Bind to localhost only
clawmetry --workspace ~/mybot      # Custom workspace path
clawmetry --name "Alice"           # Your name in Flow visualization
All options: clawmetry --help
ClawMetry shows live activity for every OpenClaw channel you have configured. Only channels that are actually set up in your openclaw.json appear in the Flow diagram — unconfigured ones are automatically hidden.
Click any channel node in the Flow to see a live chat bubble view with incoming/outgoing message counts.
| Channel | Status | Live Popup | Notes |
|---|---|---|---|
| 📱 Telegram | ✅ Full | ✅ | Messages, stats, 10s refresh |
| 💬 iMessage | ✅ Full | ✅ | Reads ~/Library/Messages/chat.db directly |
| ✅ Full | ✅ | Via WhatsApp Web (Baileys) | |
| 🔵 Signal | ✅ Full | ✅ | Via signal-cli |
| 🟣 Discord | ✅ Full | ✅ | Guild + channel detection |
| 🟪 Slack | ✅ Full | ✅ | Workspace + channel detection |
| 🌐 Webchat | ✅ Full | ✅ | Built-in web UI sessions |
| 📡 IRC | ✅ Full | ✅ | Terminal-style bubble UI |
| 🍏 BlueBubbles | ✅ Full | ✅ | iMessage via BlueBubbles REST API |
| 🔵 Google Chat | ✅ Full | ✅ | Via Chat API webhooks |
| 🟣 MS Teams | ✅ Full | ✅ | Via Teams bot plugin |
| 🔷 Mattermost | ✅ Full | ✅ | Self-hosted team chat |
| 🟩 Matrix | ✅ Full | ✅ | Decentralized, E2EE support |
| 🟢 LINE | ✅ Full | ✅ | LINE Messaging API |
| ⚡ Nostr | ✅ Full | ✅ | Decentralized NIP-04 DMs |
| 🟣 Twitch | ✅ Full | ✅ | Chat via IRC connection |
| 🔷 Feishu/Lark | ✅ Full | ✅ | WebSocket event subscription |
| 🔵 Zalo | ✅ Full | ✅ | Zalo Bot API |
Auto-detection: ClawMetry reads your
~/.openclaw/openclaw.jsonand only renders the channels you've actually configured. No manual setup required.
- Python 3.8+
- Flask (installed automatically via pip)
- OpenClaw running on the same machine
- Linux or macOS
See the Cloud Testing Guide for SSH tunnels, reverse proxy, and Docker.
This project is tested with BrowserStack.
MIT
🦞 See your agent think
Built by @vivekchand · clawmetry.com · Part of the OpenClaw ecosystem