Creating Spectral Maps
A matrix is mappable if its number of rows is equal to the number of rows of the x and y matrices in the dataset, which means that (x,y,z) pairs can be created from the data.
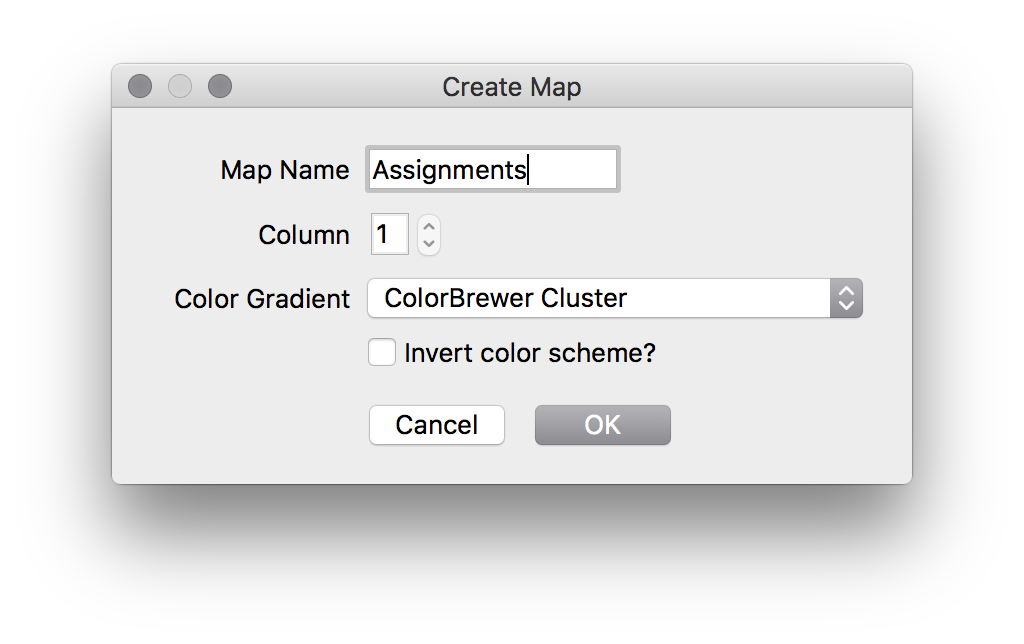
To create an image, highlight a mappable matrix, then select "Create Color Map" from the Matrix menu. This will open a dialog to allow you to select map options:
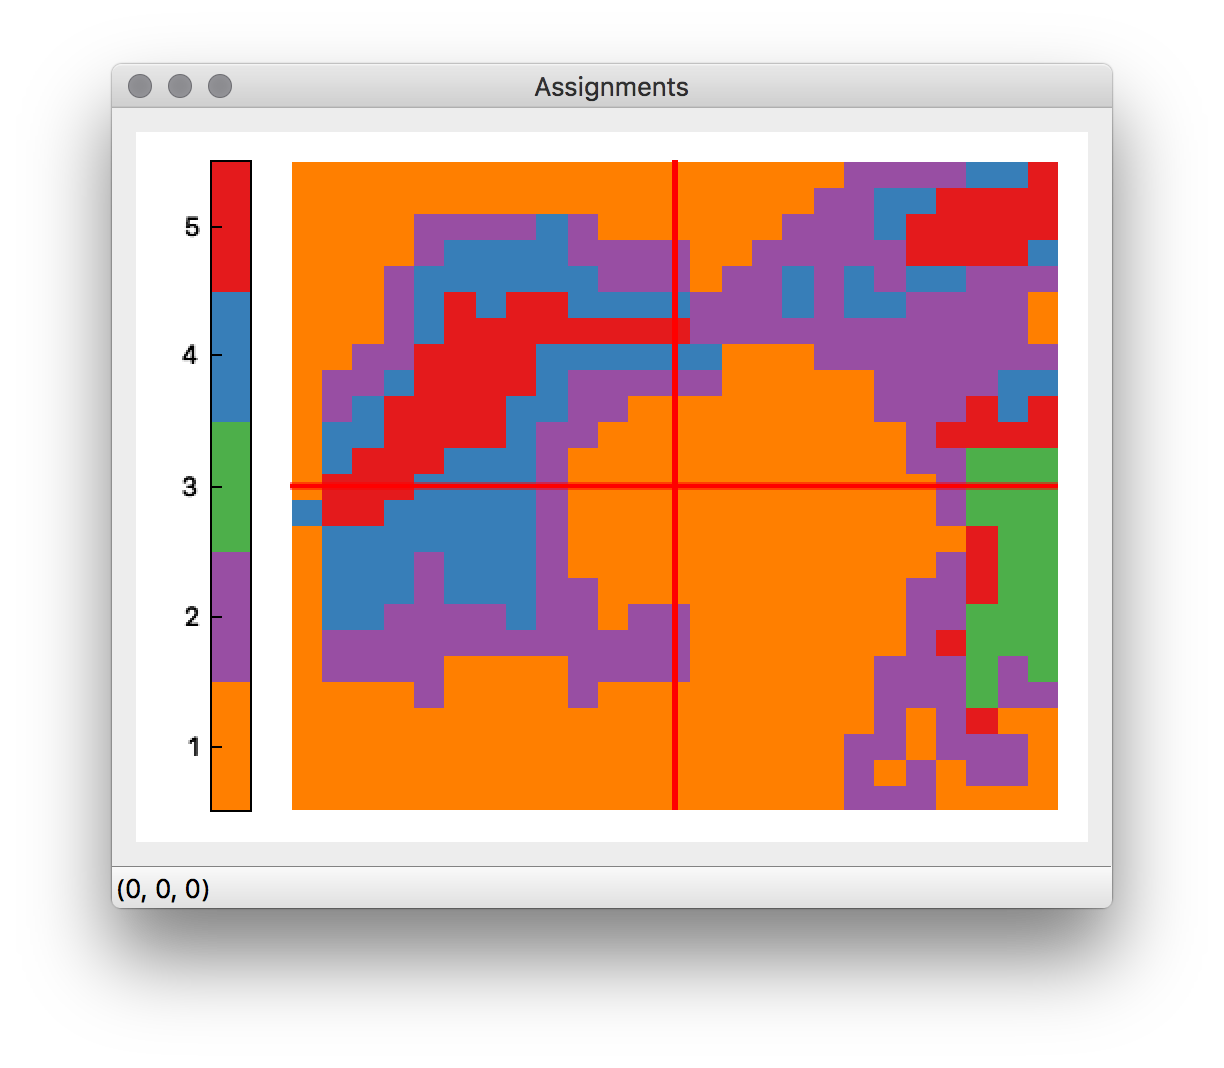
The resulting map can then be viewed by double clicking its name in the dataset explorer, elevating the map viewer:
Divergent color schemes are marked by the "↔" symbol. A divergent color scheme is a scheme where different colors are used to describe values at different ends of the range of values. These are especially useful for values like PCA scores, which are frequently distributed about 0.
Sequential color schemes are designed for data of increasing value. These are useful for values like univariate results, which usually consist of a range of positive values.
Qualitative color schemes are used for describing qualitative data, which consist of a series of discrete values. The only qualitative scheme currently supported by Vespucci is the ColorBrewer cluster scheme. This allows for up to 9 categories. For categorical data of more than 9 classes, a spectral scheme is recommended.
Vespucci supports the color schemes provided by ColorBrewer. These schemes have the following advantages:
- They scale linearly in luminosity with increased values. This means that they retain interpretability in both grayscale and color images, and that as a value increases, its brightness in the map also increases.
- They look real nice.
Vespucci also supports the schemes provided by the QCustomPlot library, which are quite similar to the schemes provided by MATLAB and Matplotlib.
Vespucci also provides a rainbow scheme (which are considered harmful) that is modified to have higher values in white, rather than darker red, decreasing the possibility of very high and very low values being interpreted as similar.