User Interface
The Vespucci user interface consists of 6 sections, shown below.
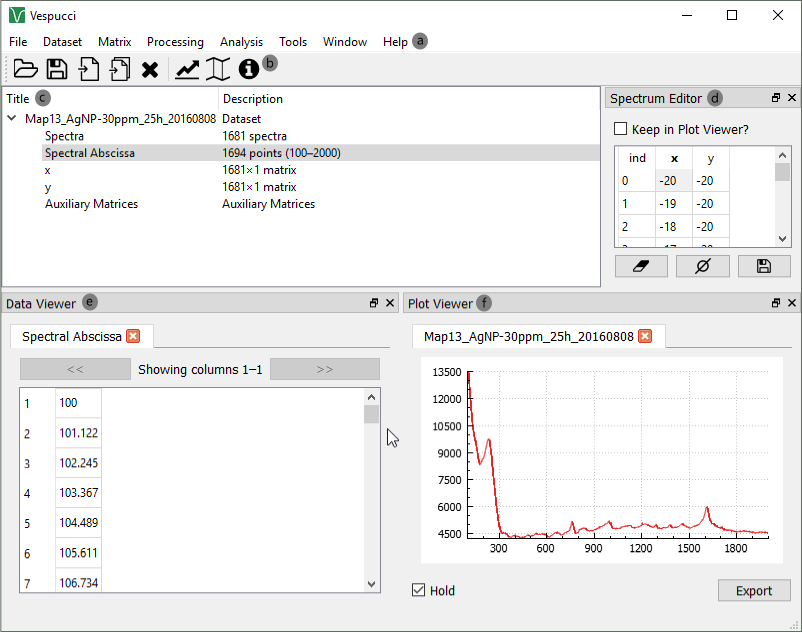
Each section will be described briefly, then in more detail.
A. Menu Bar
The menu bar contains all of the general commands for controlling Vespucci: dataset import/export, manipulation, etc. On a Mac OS, this is at the top of the screen.
B. Toolbar
The toolbar contains a group of shortcuts for frequent actions in Vespucci.
C. Dataset Navigator
The dataset navigator is used to move through the dataset and any added elements, such as a multivariate analysis.
D. Spectrum Viewer
The spectrum viewer allows one to view the individual indices of a map (a map is a 2-dimensional grid, with point spectra at each point on the grid).
E. Data Viewer
The data viewer allows one to view the actual values for a matrix one selects in the dataset navigator.
F. Plot Viewer
The plot viewer is used to view any two elements, most frequently spectra, but occasionally other elements such as PCA (Principle Components Analysis) loadings.
The menu bar contains 8 elements.
File - this contains straightforward commands regarding importing/exporting datasets, as well as saving/opening files in Vespucci's filetype.
Dataset - this contains straightforward commands regarding a single dataset.
-
"New Composite Dataset" allows one to combine datasets into a new dataset (spectra can be concatenated, or averaged together).
-
"New Dataset From Matrix" allows one to select individual elements of an analysis, and then form a new dataset from that (as an example, selecting a single cluster assignment from a k-means analysis to form a dataset).
Matrix - this contains options for manipulating specific matrices within the dataset.
-
"Analyze" allows one to perform several multivariate analyses on a single matrix, rather than an entire dataset.
-
"Transform" allows one to perform a simple transform operation on a single matrix.
Processing - this contains commands for dataset manipulation such as baseline correction or normalization. Refer to Smoothing, Baseline Correction and Normalization for more information.
Analysis - this contains commands for extrapolating information from the dataset, such as k-means cluster analysis or a univariate analysis.
-
"Calculate Representative Spectrum" creates a single spectrum based off of all others in the dataset. Each wavenumber value can be determined in two different ways: by taking the average of each spectrum's wavenumber value, and by taking the median of of each spectrum's wavenumber value. Additionally, each spectrum will be compared to the representative spectrum (based on a selected distance metric) to find the one most similar to the representative spectrum. See Representative Spectrum
-
"On Multiple Datasets" performs an analysis on multiple datasets. This temporarily concatenates the datasets to perform an analysis, giving combined results. The results are then separated out for each dataset, giving results specific to an individual dataset which incorporated the entire group of datasets in the analysis. See Analyzing Multiple Datasets
Tools - this contains simple settings for Vespucci.
Window - this shows various dialogs of Vespucci which can be enabled as needed. The most commonly used dialogs are enabled automatically. New dialogs are opened in a new window, rather than as a part of the standard Vespucci window.
Help - This contains information about using Vespucci (including a link to this wiki).
The toolbar contains 8 elements, described below.
Open Dataset (folder) - opens a file saved in the Vespucci HDF5 format (.h5).
Save Dataset (disk) - saves the dataset in the Vespucci format.
Import Dataset (page with arrow) - imports a single dataset. This is described in more detail on the Importing Data page.
Import Multiple Spectra (pages with arrow) - imports multiple "point spectra" into a single dataset. This is described in more detail on the Importing-Data page.
Close Dataset (X) - closes the current dataset.
Plot Result (graph) - plots the elements in a matrix versus one another, unless a different abscissa is selected. For example, when using this with the "spectra" matrix, the y vs. x are values in the matrix itself. In this case, the spectral abscissa is automatically selected (which then ignores the selected x value), but that can be changed by changing the abscissa value from "Spectral Abscissa" to "Column." See also Creating Plots
Create Color Map (map) - creates a map of the matrix elements. This can only be done if the number of elements is the same as the x and y values. See also Creating Spectral Maps.
Info ("i" in circle) - gives various info about the selected matrix:

The dataset navigator is a straightforward area that contains all of the elements of your dataset--the matrices it was imported with (spectra, abscissa, x, y), and any new analyses performed in a tree hierarchy. Pressing the small arrow to the left of the text opens the branch to view the elements within that group.
The spectrum editor contains each spectra in the dataset, organized according to its position in the map. It is sorted by the order contained in the original file. Clicking on either the x or y coordinate brings up the same spectra.
The three buttons at the bottom of the page are:
Delete Spectrum (eraser) - this deletes the selected spectrum. Be warned--if this is done, the data cannot be mapped because of a missing location in the map.
Zero Spectrum (Ø) - this replaces all data in the spectrum with 0. This allows for mapping to be done afterwards.
Export Spectrum (disk) - this allows one to export a single spectrum, through Vespucci, in standard file types (.csv, .txt).
The "Keep in Plot Viewer" checkbox keeps a previous spectrum in the plot viewer when a new one is selected. This option requires another option (covered in the appropriate section) in the Plot Viewer to work correctly.
The data viewer contains all elements of a selected matrix. Please note that, unlike other elements, the desired matrix must be double-clicked for the values to appear in the data viewer. Only 15 columns are displayed at a time.
The plot viewer simply allows one to view data as a graphical plot. Each time a new plot is selected (such as in the spectrum viewer, or if one manually creates a plot from PCA loadings for example), a new tab is created with the new plot.
The "Hold" checkbox, however, allows one to keep the current tab open and not open any new tabs. Thus, checking "Hold" and selecting various spectra would keep the tab and simply change out the spectra each time. This can minimize the cumbersome nature of multiple tabs. In addition to this, by keeping the "Keep in Plot Viewer" option checked as well, one can "stack" various spectra on the same plot to view at the same time. Please note that the plot will scale to the largest spectra.
Plots can be added to the plot viewer several different ways. Matrices can be plotted using the Create Plot option from the Matrix menu. Map viewer windows will also send permanent or transient plots to the plot viewer. When a map is created, a new tab is created in the plot viewer with the hold checkbox on, navigating with arrow keys will send transient plots to the plot viewer. See Creating Spectral Maps for more information.
The "Export" button allows one to export an image of the spectrum. In this way one might save an image of several related spectra.