Map Options
You can save a map by selecting "Save Image As" from the File menu. Vespucci can export images in the following formats:
| Format | Type | Transparency? | Properties |
|---|---|---|---|
| PNG | Lossy bitmap | yes | Preferred for web pages |
| JPEG | Lossy bitmap | no | Generally lower quality than PNG |
| GIF | Lossy bitmap | no | Larger than JPEG, lower quality than PNG |
| TIFF | Lossless bitmap | yes | Largest file size, highest quality bitmap |
| BMP | Lossless bitmap | no | May be preferred over TIFF for compatibility, otherwise choose TIFF |
| SVG | Vector | yes | Will render interpolated in some web browsers, not supported by MS Office |
| Vector | yes | Fixed to Letter-sized page, not supported by MS Office | |
| EMF | Vector | yes | Has artifacts if saved from non-Windows OS |
More often than not, you should choose either PNG (smaller file size) or TIFF (higher fidelity).
Choose a vector format when you intend to resize the image to an arbitrary size, such as make it large for a poster, but small for a presentation. Vector formats will also allow you to edit the image in software such as Adobe Illustrator (and sometimes even Inkscape).
EMF files look really spiffy in Office, especially when you make them drawing objects by selecting edit from the context menu. However, due to the fact that EMF comes from Microsoft's GDI API, support for it on non-Windows operating systems is limited. If you are using Vespucci from a non-Windows OS, there will by "stripe" artifacts on your EMF files.
Choose a format supporting transparency when you intend to use the image against a non-white background.
There is no compelling reason to use JPEG, GIF or BMP for this kind of image in whatever year it is now, but you can if you want.
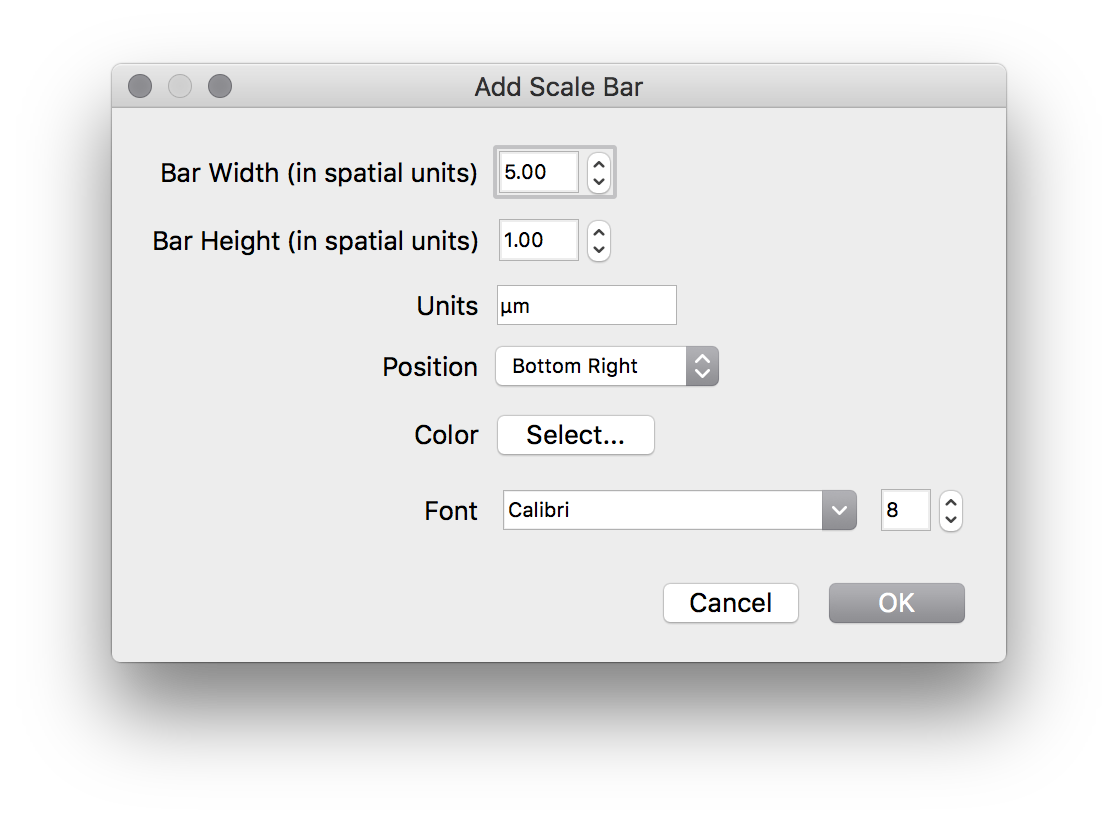
To add a scale bar to an image, select "Add Scale Bar" from the Display menu. You will be presented with a dialog allowing you to specify the color, font, size, units and position of your scale bar. Unfortunately, you cannot undo this, but creating a map in Vespucci is trivial.
If, for some reason, you want to mislead your readers about the precision of your spatial data, you can turn image interpolation on by selecting "Interpolate" from the Display menu. This will make your map look more like a fluorescent microscopy image, at the expense of your integrity as a scientist.
| Uninterpolated | Interpolated |
|---|---|
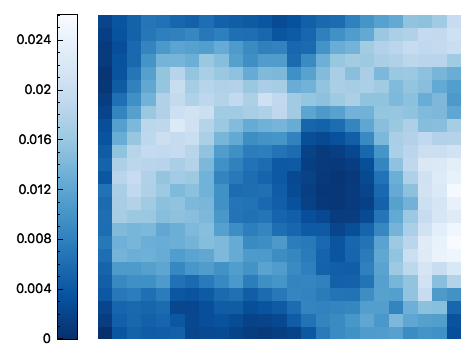 |
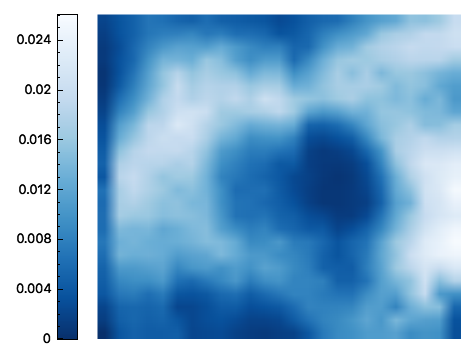 |
You can set the axis rectangle (the actual "map" without the color scale or axis labels) to a fixed size in pixels, inches or centimeters by selecting "Set Size" from the Display menu.
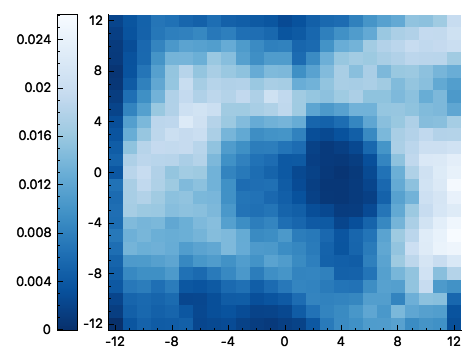
If you want to be able to see the x and y values of your map without moving the crosshairs, you can enable their visibility by selecting "Show Axes" from the Display menu.
| Axes Off | Axes On |
|---|---|
|
 |
If you are using data consisting of both positive and negative values, and are using a divergent color scheme, it is useful (and more visually honest) to center that color scale about 0. To do this, select "Center Color Scale at 0" from the Display menu.
| Uncentered | Centered |
|---|---|
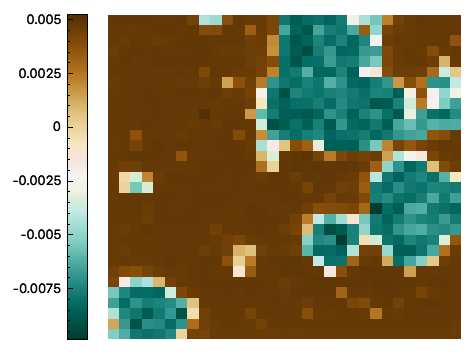 |
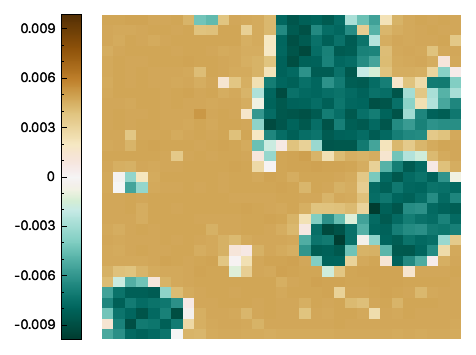 |
You can add a color scale label by selecting "Add Color Scale Label" from the Display menu.
Currently, the only position for the color scale is at the left of the image. In future versions, Vespucci will support placing the color scale at the top, bottom, or right of the image.
You can change the color scheme of the image by selecting "Set Color Scheme" from the Display menu.
In each session of Vespucci, you can define global color schemes, which will update whenever applied to a new map. You can access global schemes from the main window under Tools->Global Color Schemes.