Correlation
According to the [Statistics Knowledge Portal, correlation is a statistical measure that expresses the extent to which two variables are linearly related (meaning they change together at a constant rate). It’s a common tool for describing simple relationships without making a statement about cause and effect.
AllInOne offers three different types of correlations:
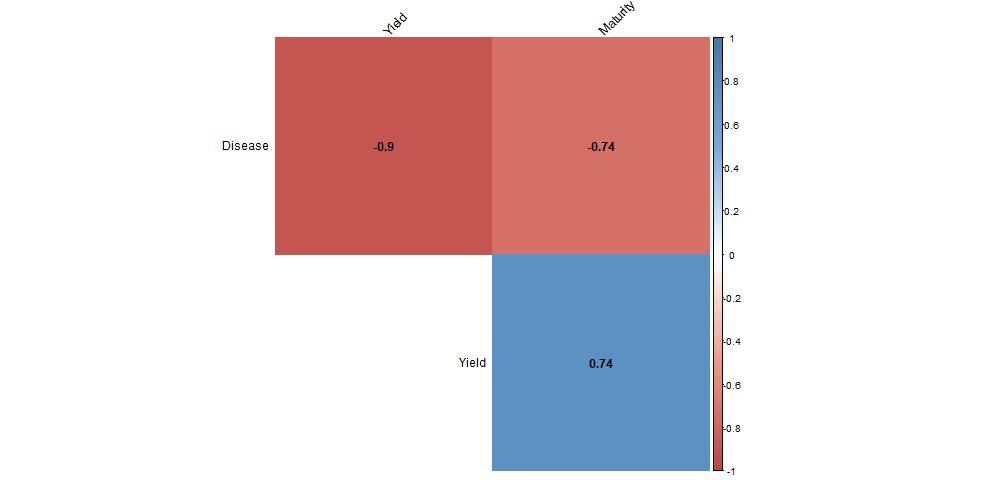
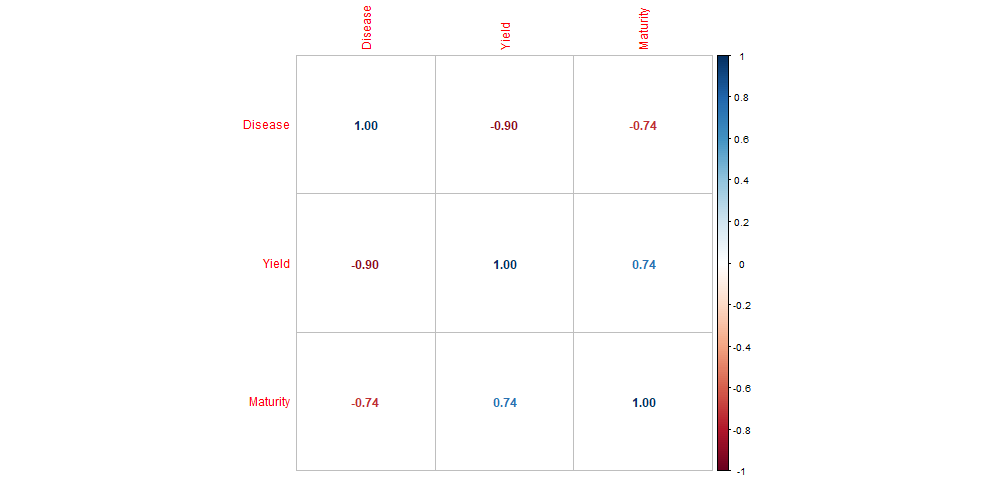
This type of correlation is based on the general correlation between all selected dependent/response variables.
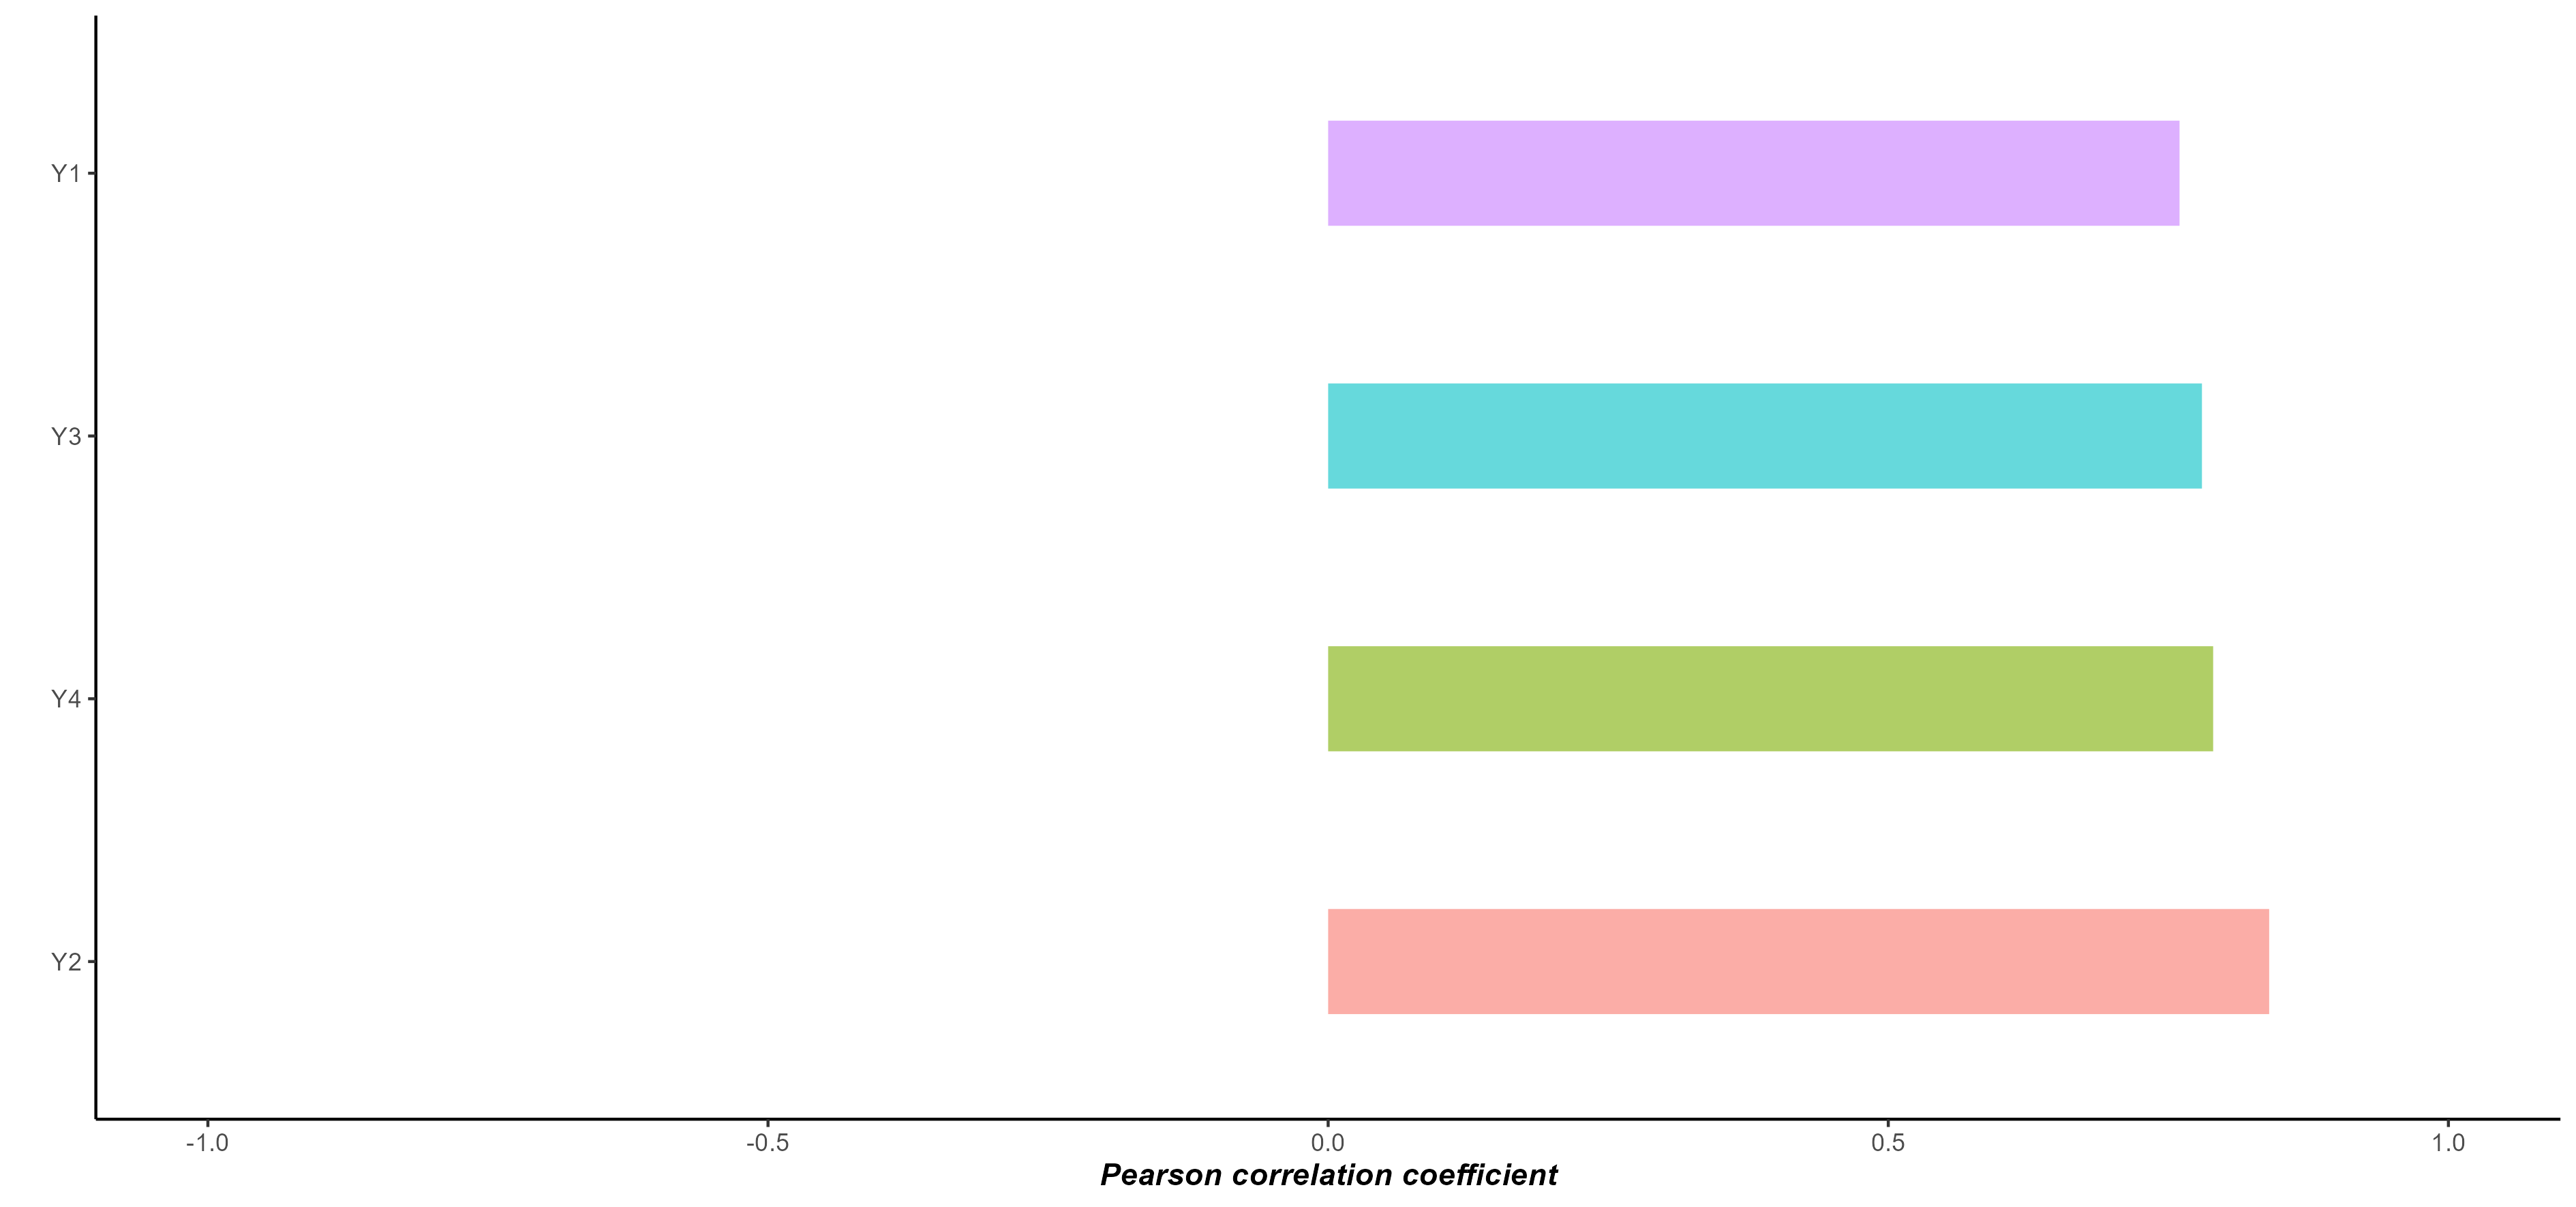
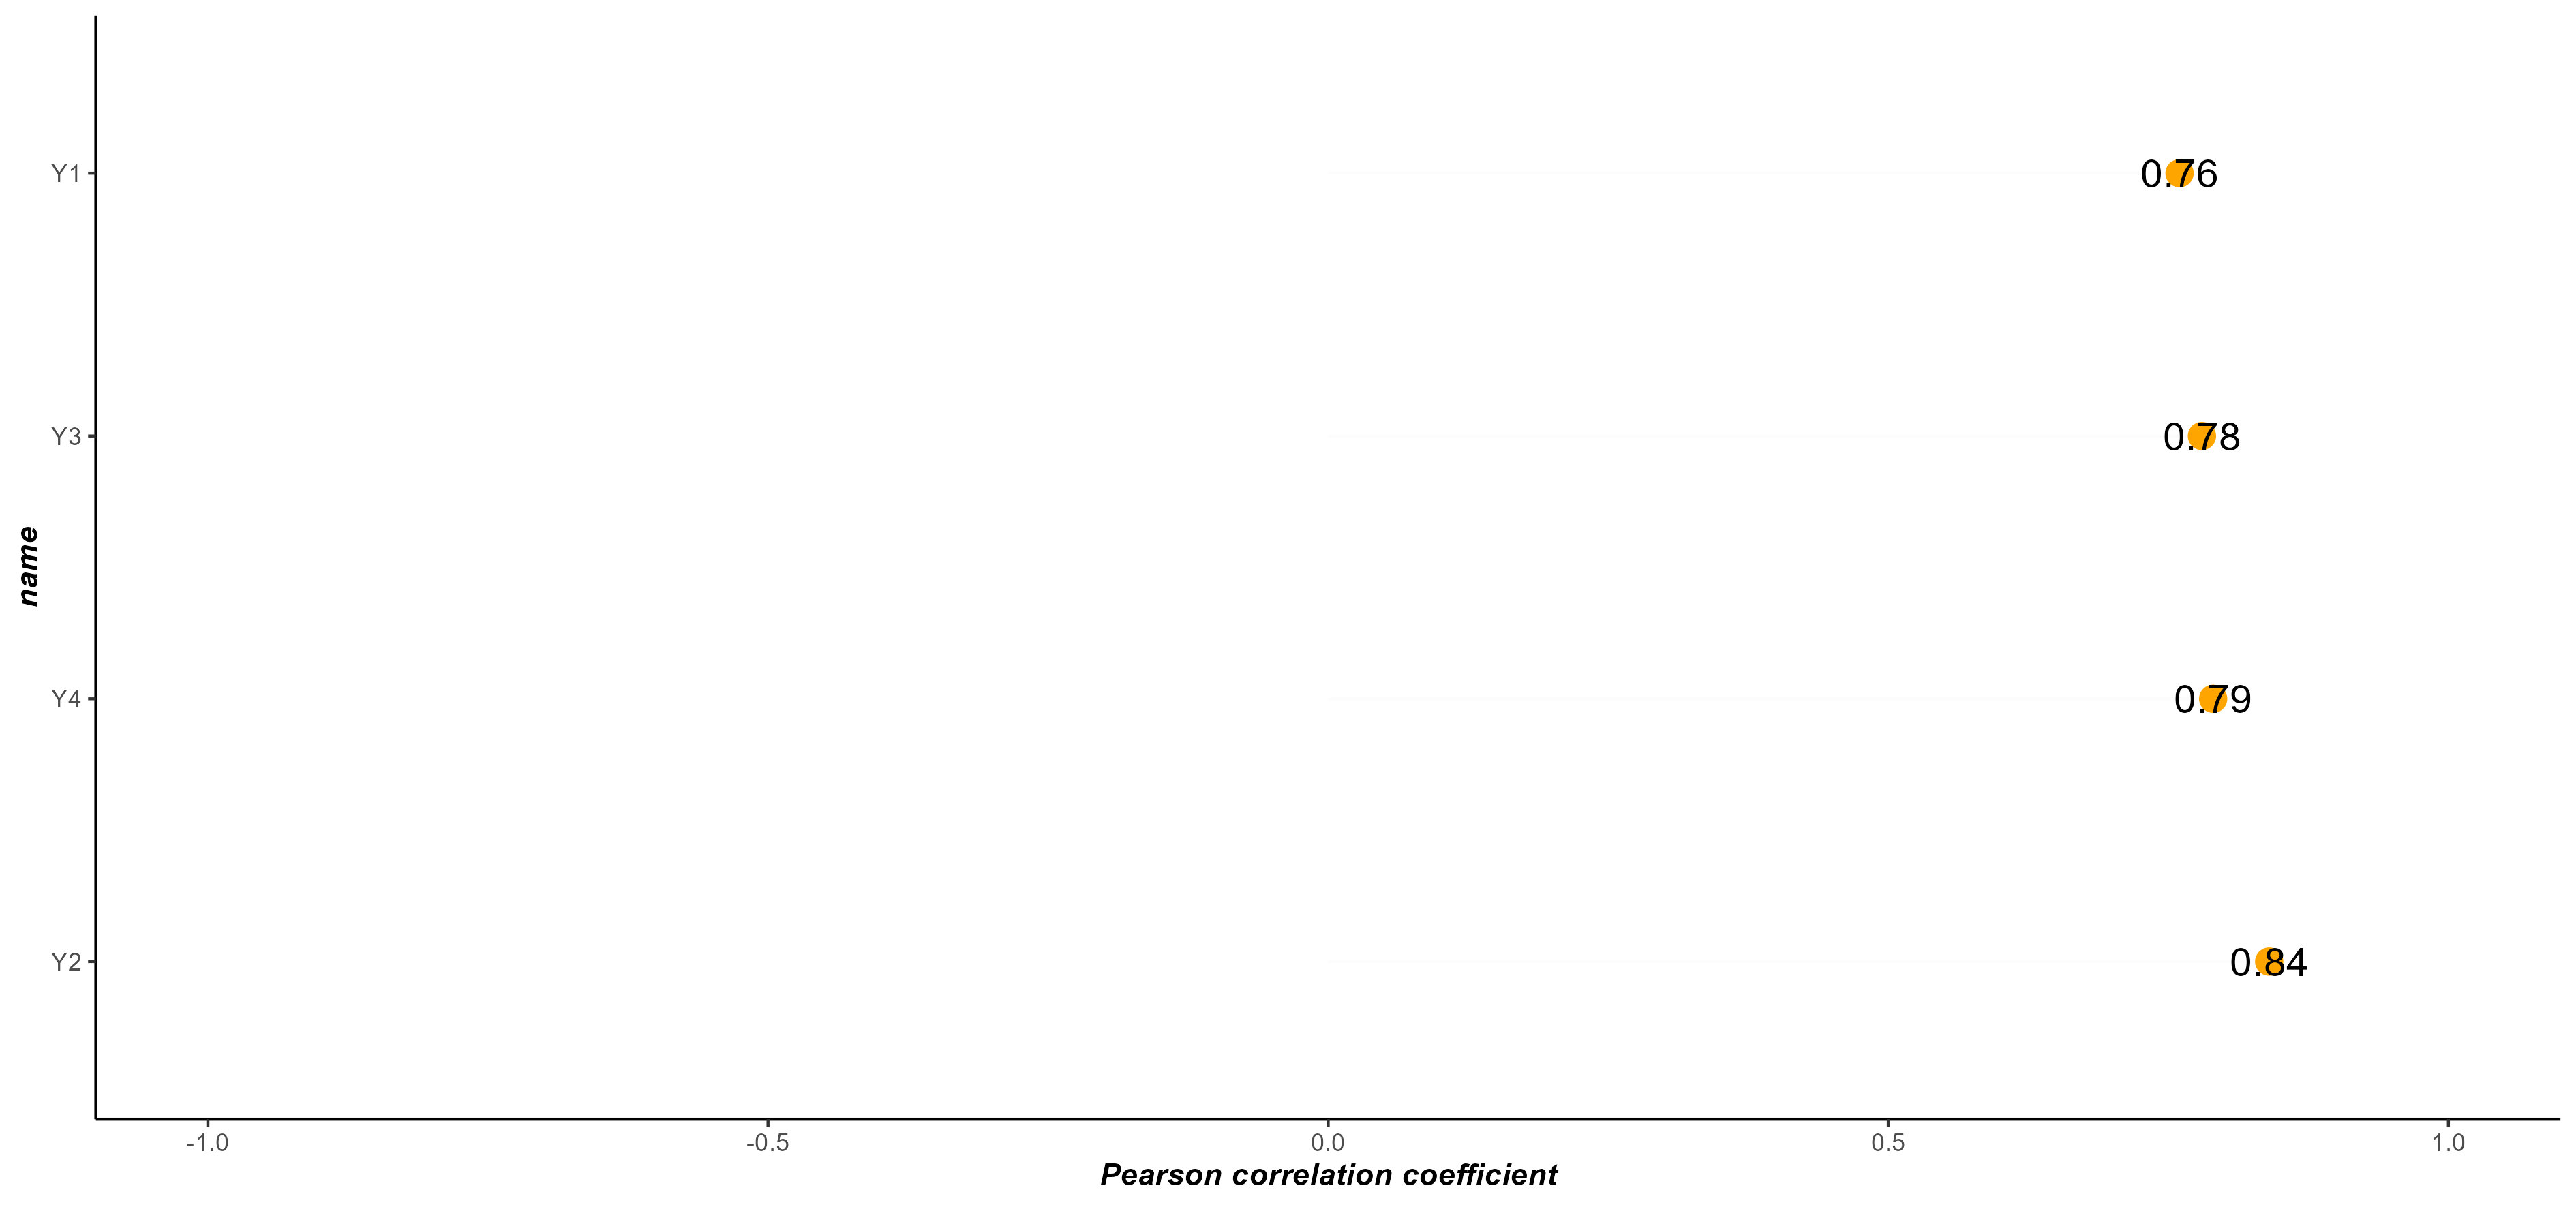
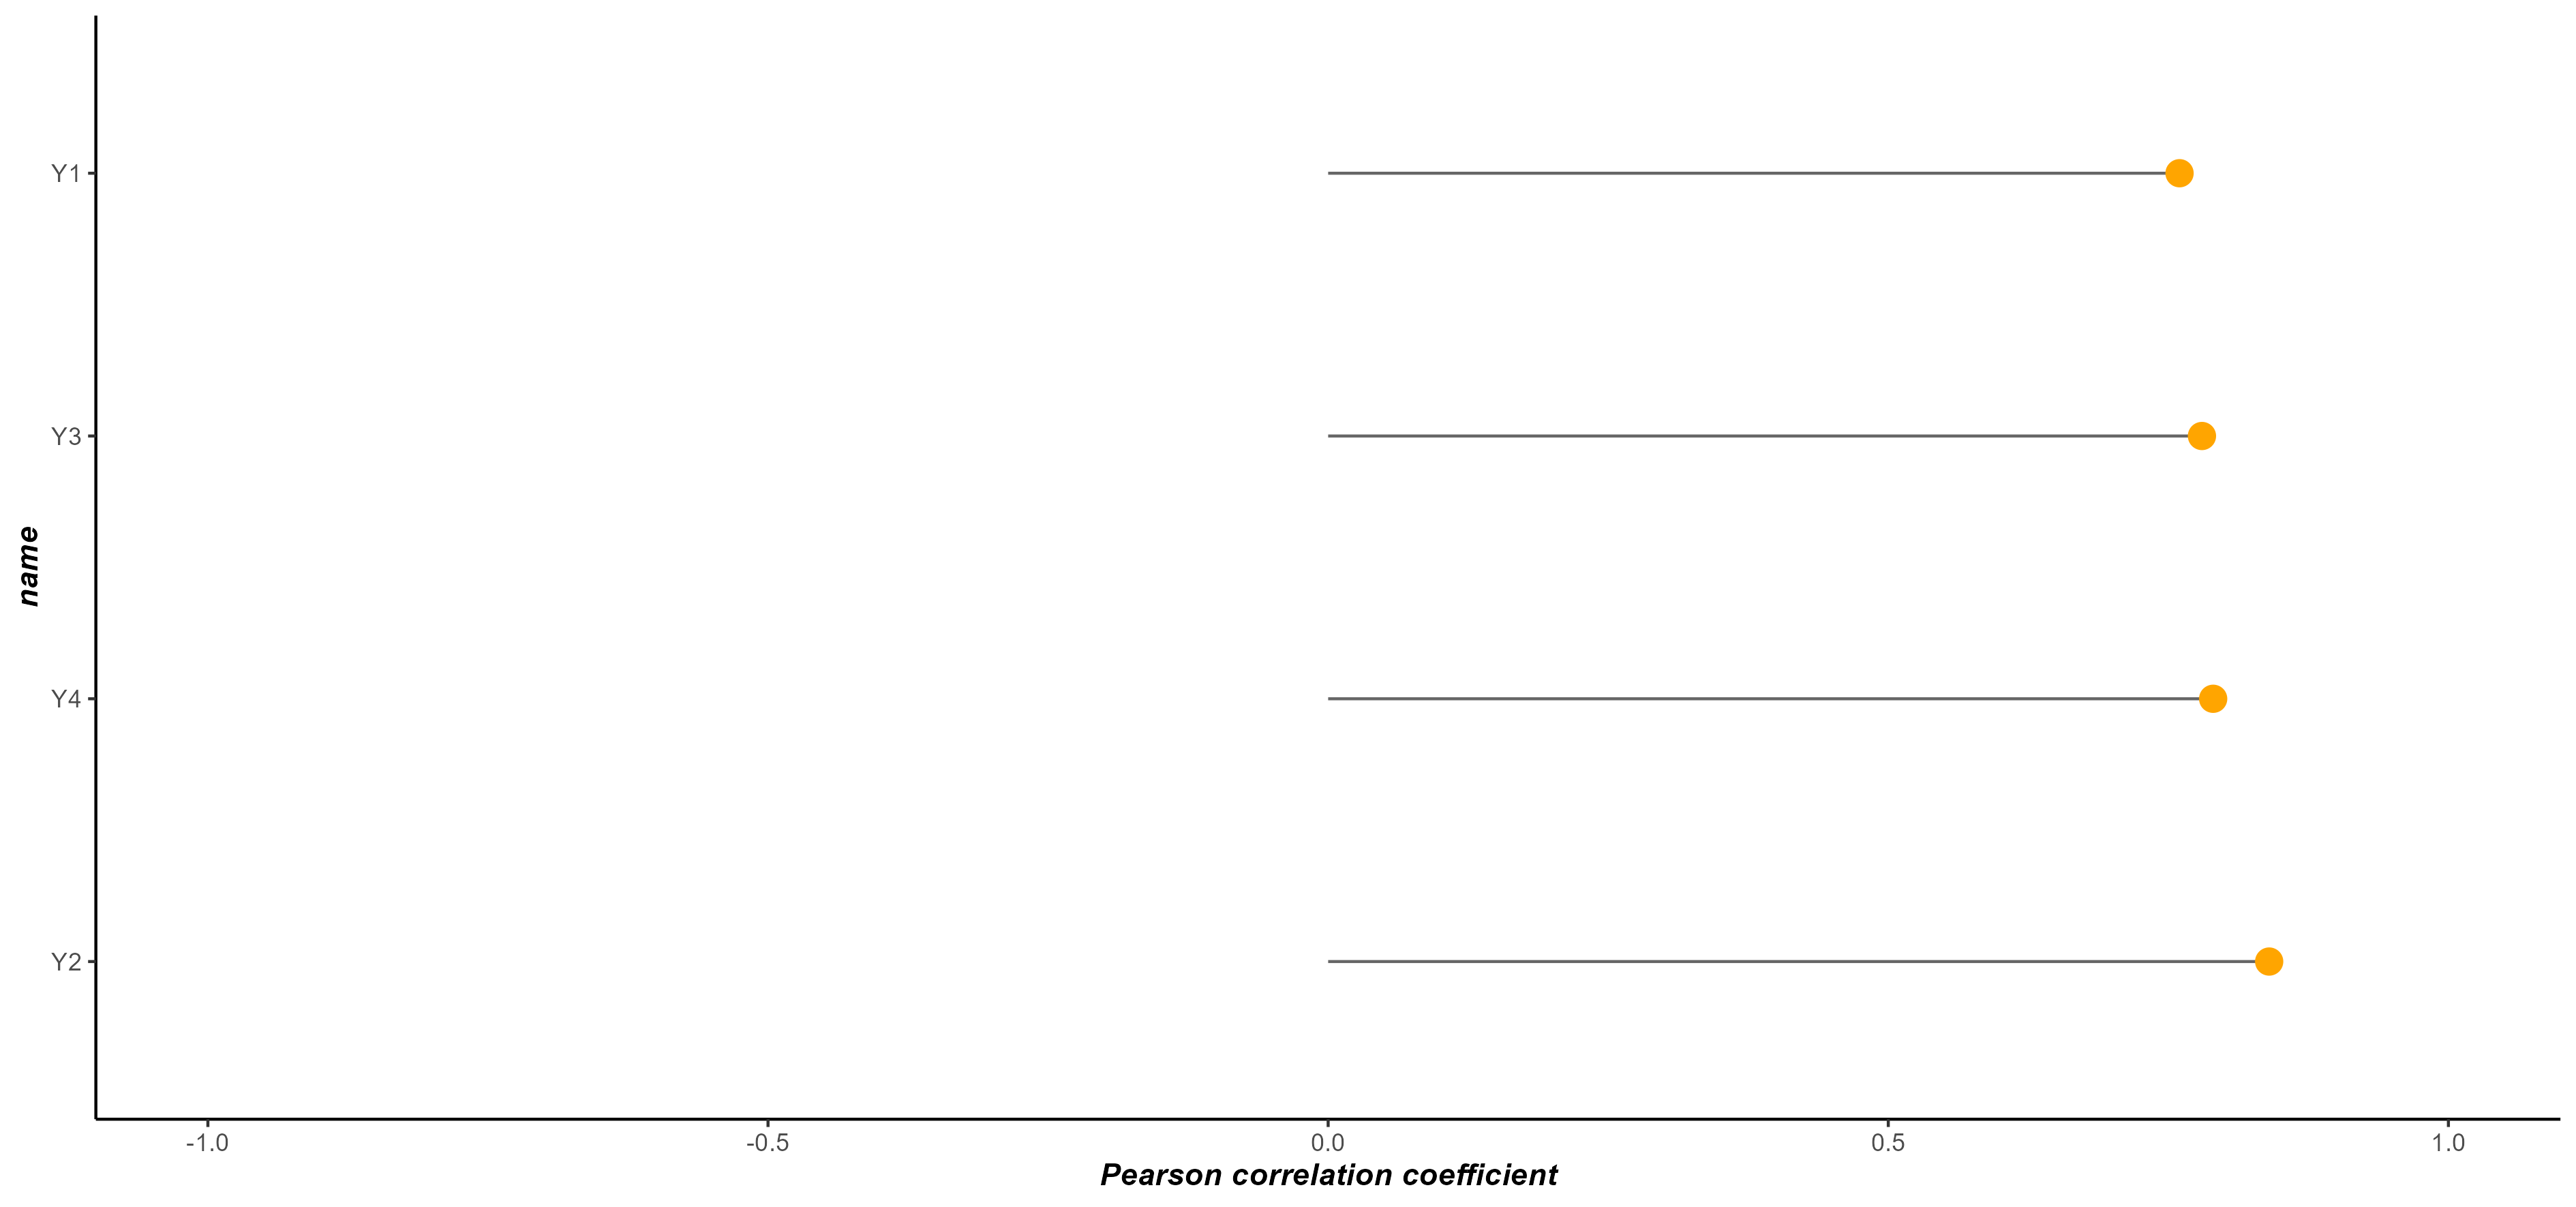
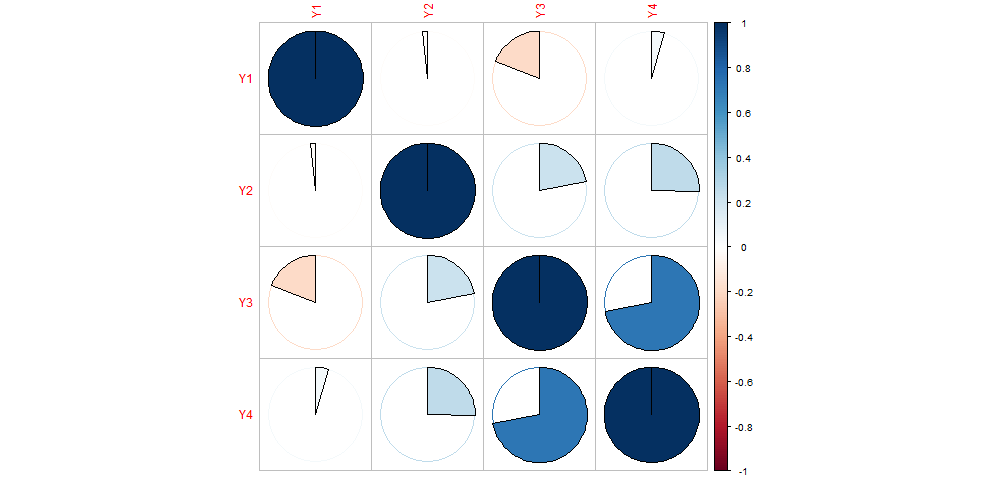
In addition to the correlation table, AllInOne provides different correlation plots and you have the option to select the best one:
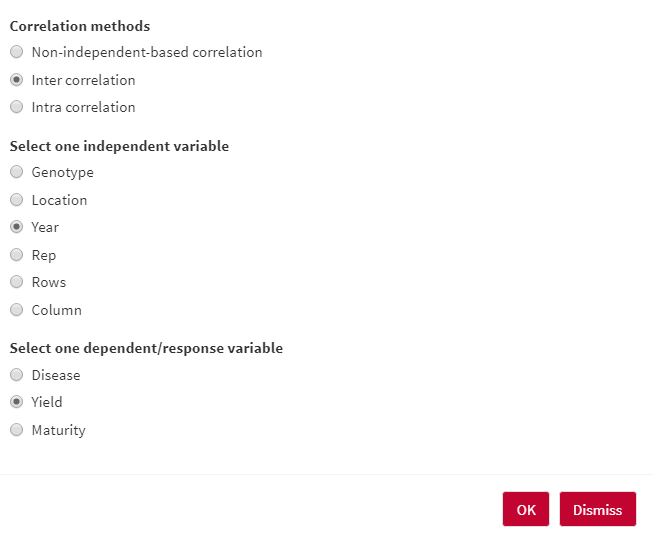
Inter correlation is a great option that would be available for the first time in AllInOne. This method basically calculates the correlation between the level of one independent/factor variable in one dependent/response variable.
As an example, assume you are a breeder who would like to see if the crop yield is correlated among different years of planting in the field. The correlation between the level of a factor shows how much levels are similar to each other and the response variable follows the same pattern in levels.
You can select an independent/factor variable and dependent/response variable as follows:
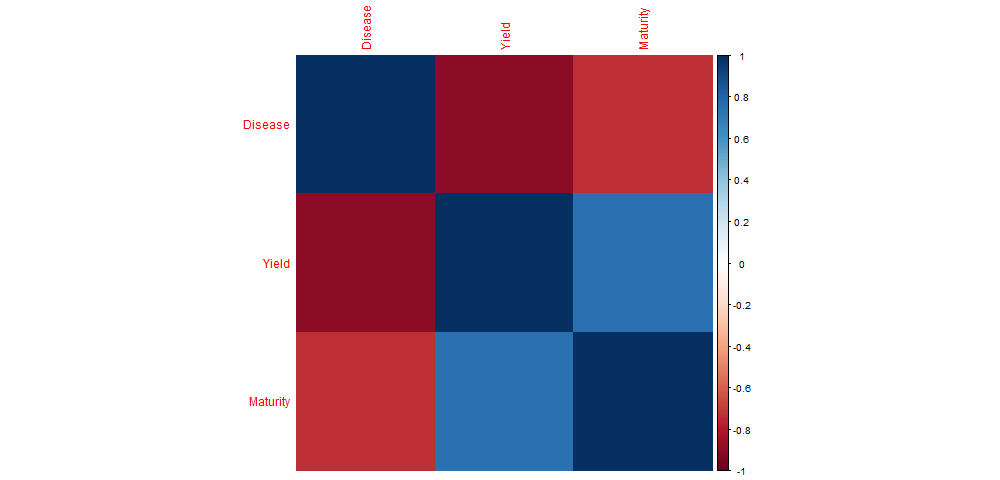
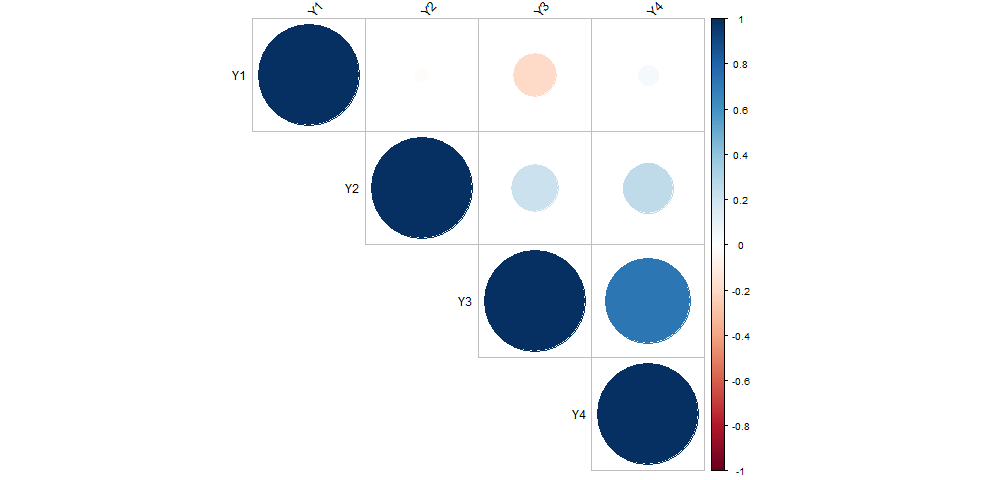
In addition to the correlation table and a table providing all the response data in each level of the factor variable, AllInOne provides different correlation plots and you have the option to select the best one:
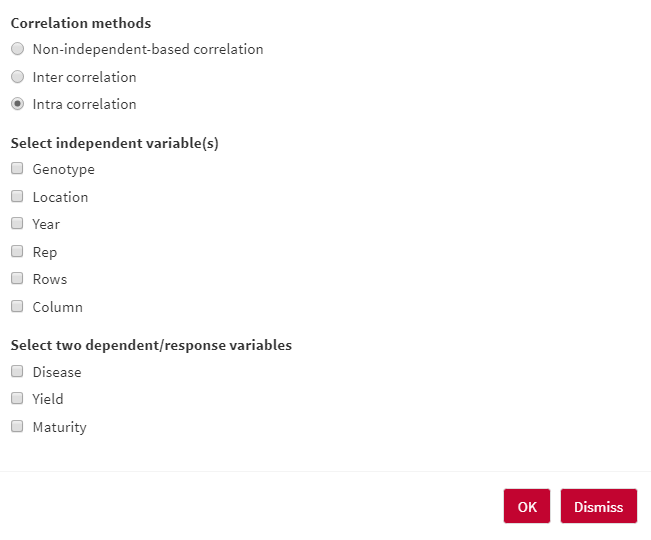
Inter correlation is another novel option that would be available for the first time in AllInOne. This method basically calculates the correlation between two dependent/response variables in each level of independent/factor variables.
As an example, assume you are a breeder who would like to see if the crop yield and maturity are well correlated with each other among different years of planting in the field. You can then remove those years if the correlation between the yield and maturity is not high or acceptable for your breeding program.
You can select independent/factor variables and dependent/response variables as follows:
In addition to the correlation table, AllInOne provides different correlation plots and you have the option to select the best one: