Normalization
Normalization is known as one of the important pre-processing steps for different types of problem statements (Patro, S., & Sahu, K. K.,2015). There are different types of normalization methods such as scaling, box-cox, ordered quantile (ORQ), Yeo-Johnson, logarithm, and arcsinh normalization transformation.
Here in AllInOne, we tried to use bestNormalize and MASS Packages in a user-friendly way to check the normality of the dataset and select the best normalization method.
First select Normalization from the Pre-Processing Steps options:
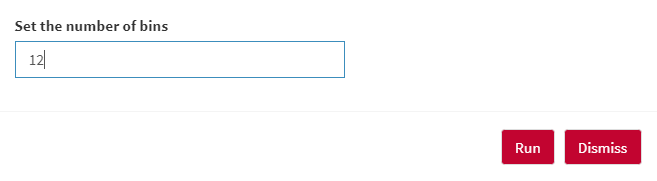
Then select The desired number of bins (classes) for the histogram plots as follow:
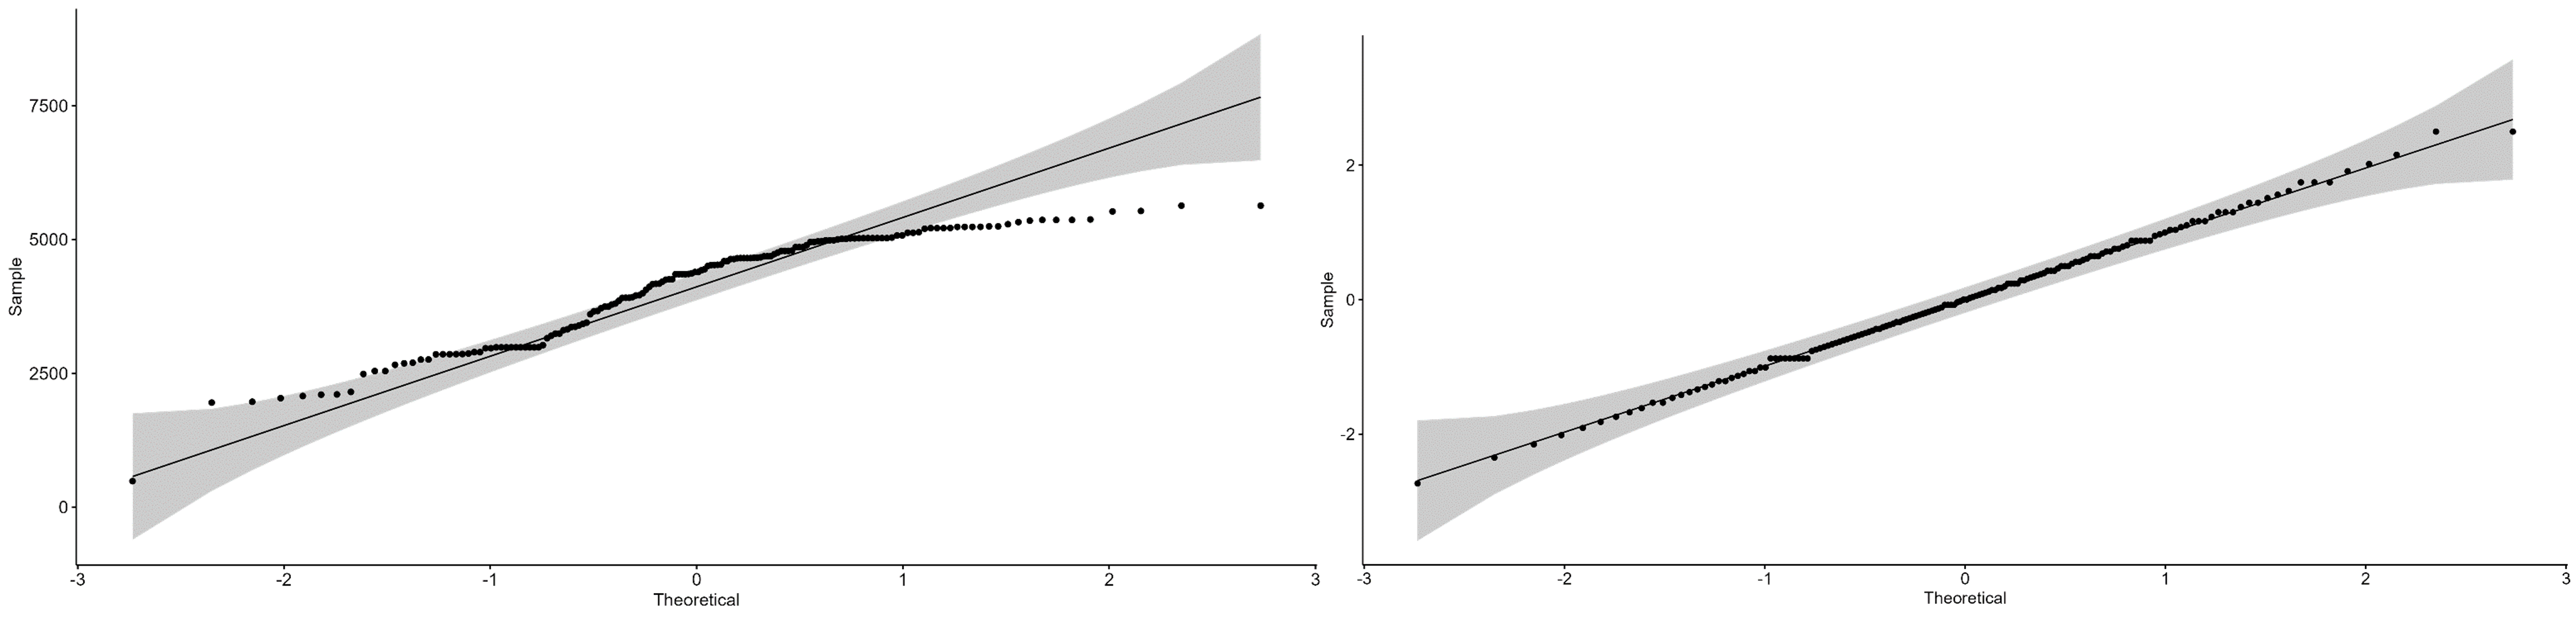
A Q–Q plot is a plot based on estimates (X-axis) and observed (Y-axis) quantiles for the selected dependant/response variable.
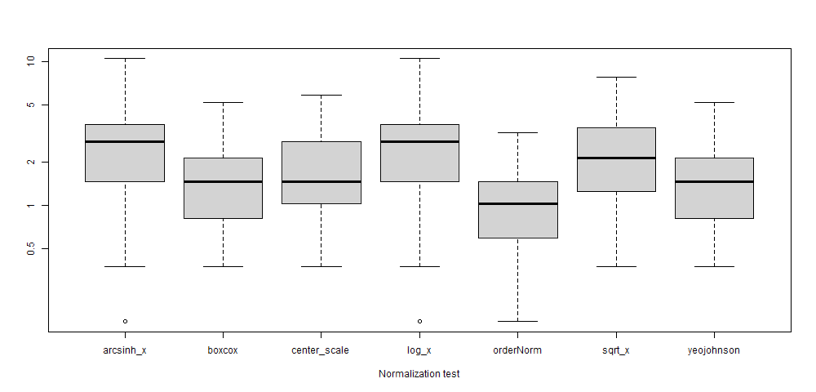
The normality plot is the visualizing out-of-sample estimates of normality. The bestNormalize function will save the estimated normality statistics that it obtained for each fold and repeat of cross-validation. Users can visualize these relatively easily, which may give some insight into how much the transformation is truly preferred by the normality statistic, or if it doesn’t matter so much as which transformation is chosen.
More information about each method are available here.
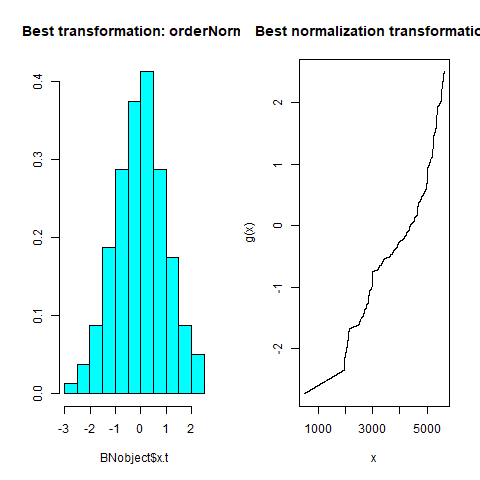
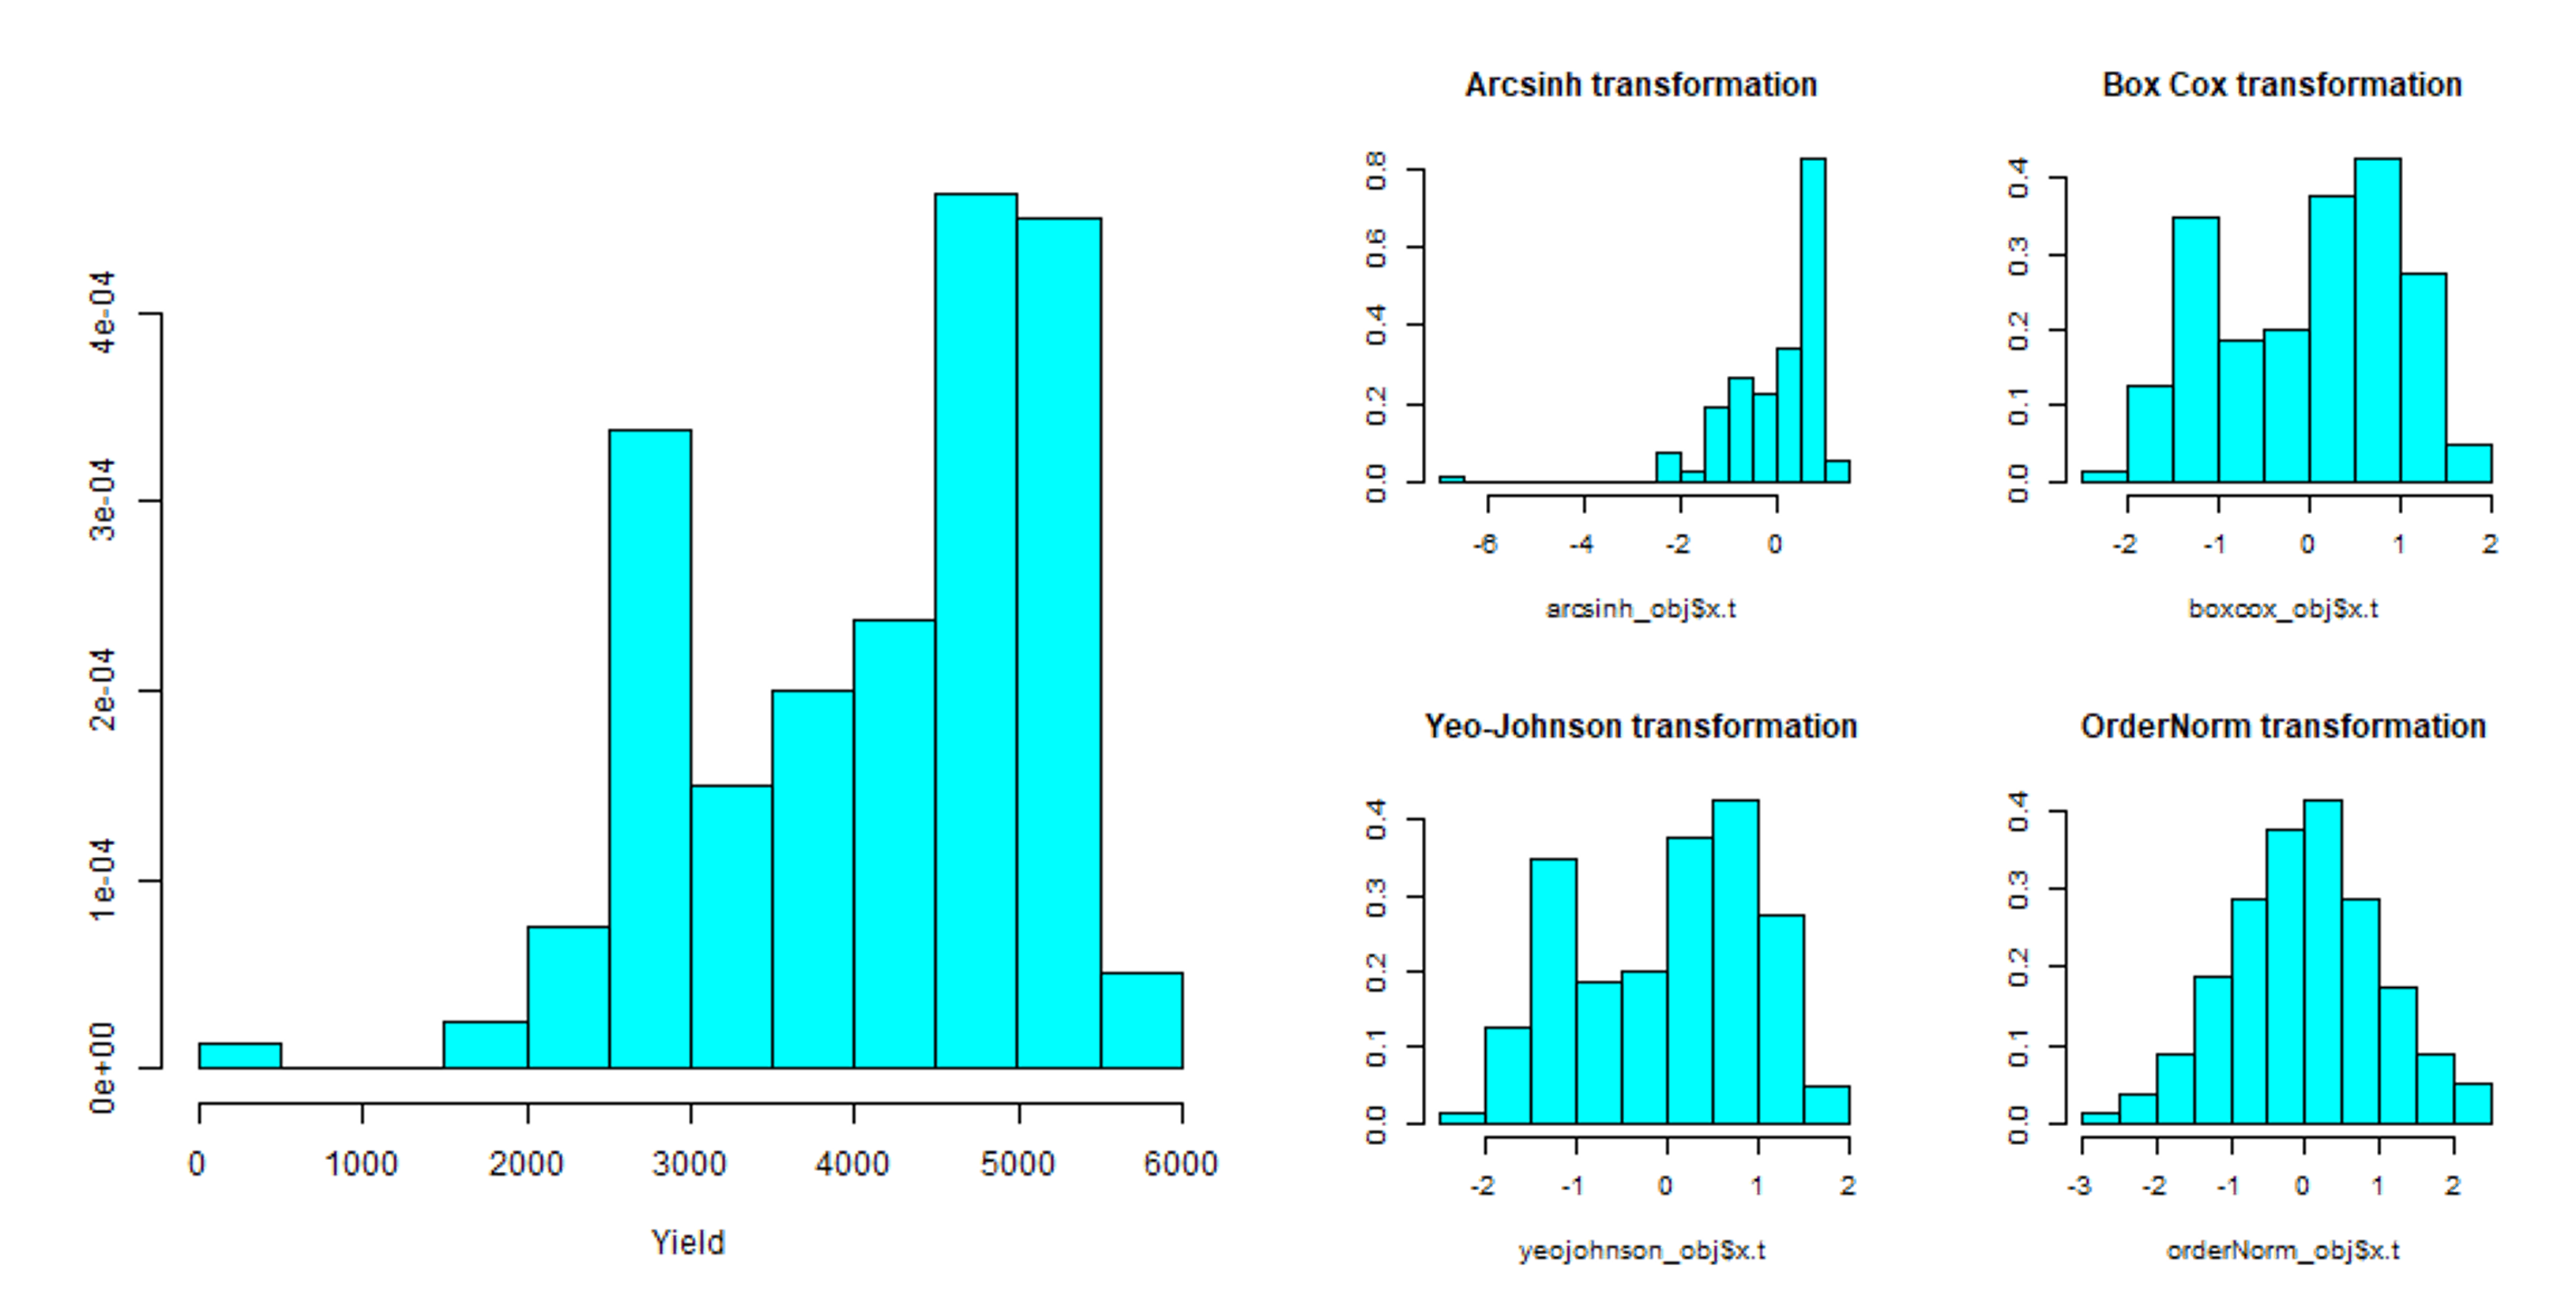
In the current version of AllInOne, four of the most common normalization methods (arcsinh, Box Cox, Yeo-Johnson, and OrderNorm) will be selected for the further steps:
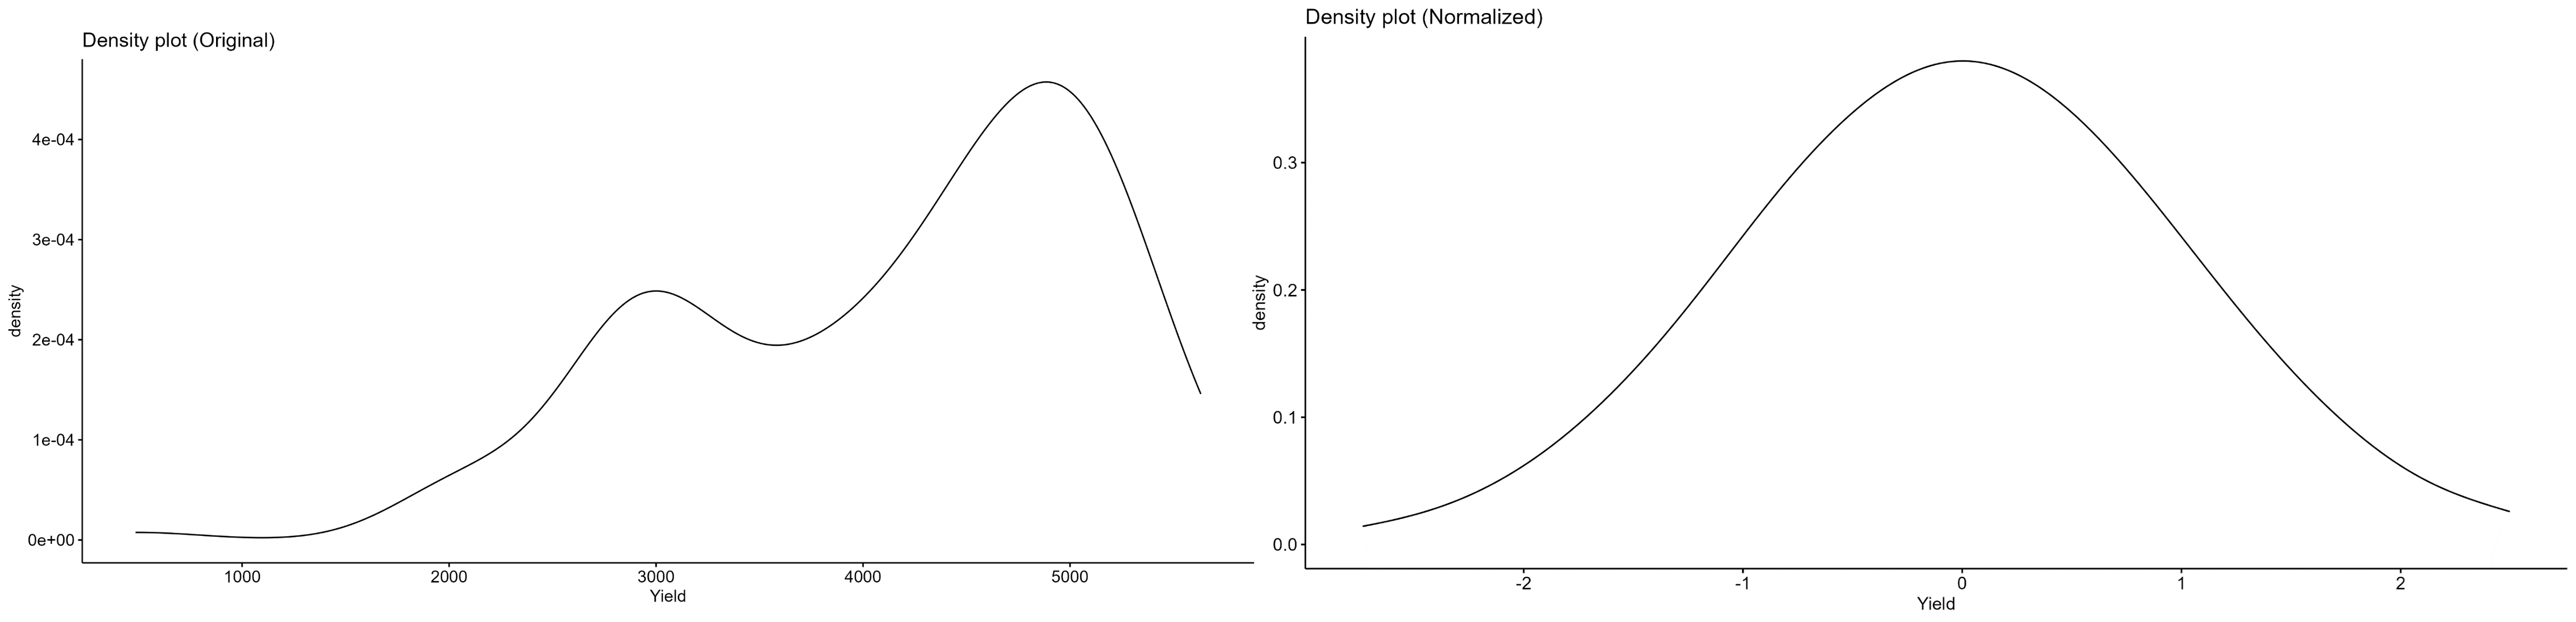
Below you can see the original distribution (left) and the new distribution (right) of the selected dependant/response variable based on the selected four normalization methods.
The bestNormalize function selects the best transformation according to the Pearson P statistic (divided by its degrees of freedom), as calculated by the nortest package. There are a variety of normality tests, but the benefit of the Pearson P / df is that it is a relatively interpretable goodness of fit test, and the ratio P / df can be compared between transformations as an absolute measure of the departure from normality (if the data follows close to a normal distribution, this ratio will be close to 1). The transformation whose transformed values fit normality the closest according to this statistic (or equivalently, this ratio), is selected by bestNormalize (more ...)..