Variance Analysis
Analysis of variance (ANOVA ) is known as one of the important statistical techniques widely used to analyze the differences among means. The basis of the ANOVA technique was developed by the statistician Ronald Fisher and is used to assess the variation among and between groups.
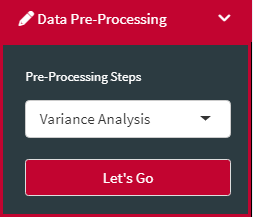
Here in AllInOne, You can select the Variance Analysis option from Pre-Processing Steps:
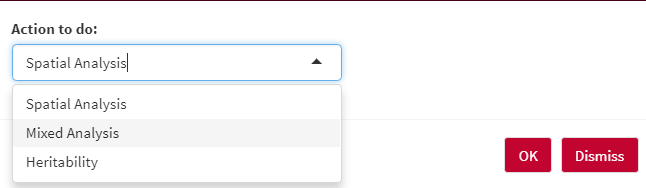
and run spatial analysis and mixed analysis, as well as calculate heritability:
Spatial analysis is an important analysis method used to correct the possible spatial effects in the experiment. Recently, Rodriguez-Alvarez et al. (2018) introduced new spatial analysis methods, called "spatial variation explicitly using 2D P-splines" to better control the spatial effects. AllInOne uses the power of SpATS R package to run a spatial analysis of field trials with splines.
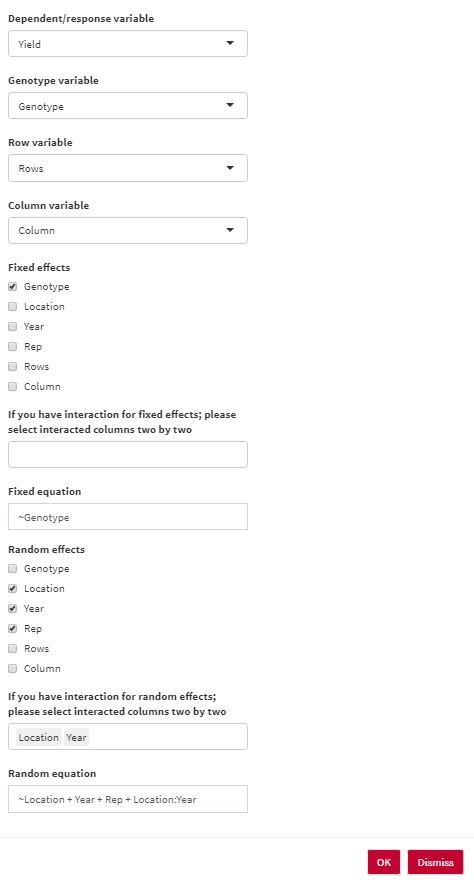
- Dependent/response variable: Select the response variable that you are going to work with.
- Genotype variable: Select the column containing genotype names.
- Row variable: Select the column containing Row numbers.
- Column variable: Select the column containing Column numbers.
- Fixed effects: Select fixed variables in your analysis.
- If you have interaction for fixed effects; please select interacted columns two by two.
- Fixed equation: the overall shape of the fixed effect equation. You are able to edit the final equation here.
- Random effects: Select random variables in your analysis.
- If you have interaction for random effects; please select interacted columns two by two.
- Random equation: the overall shape of the random effect equation. You are able to edit the final equation here.
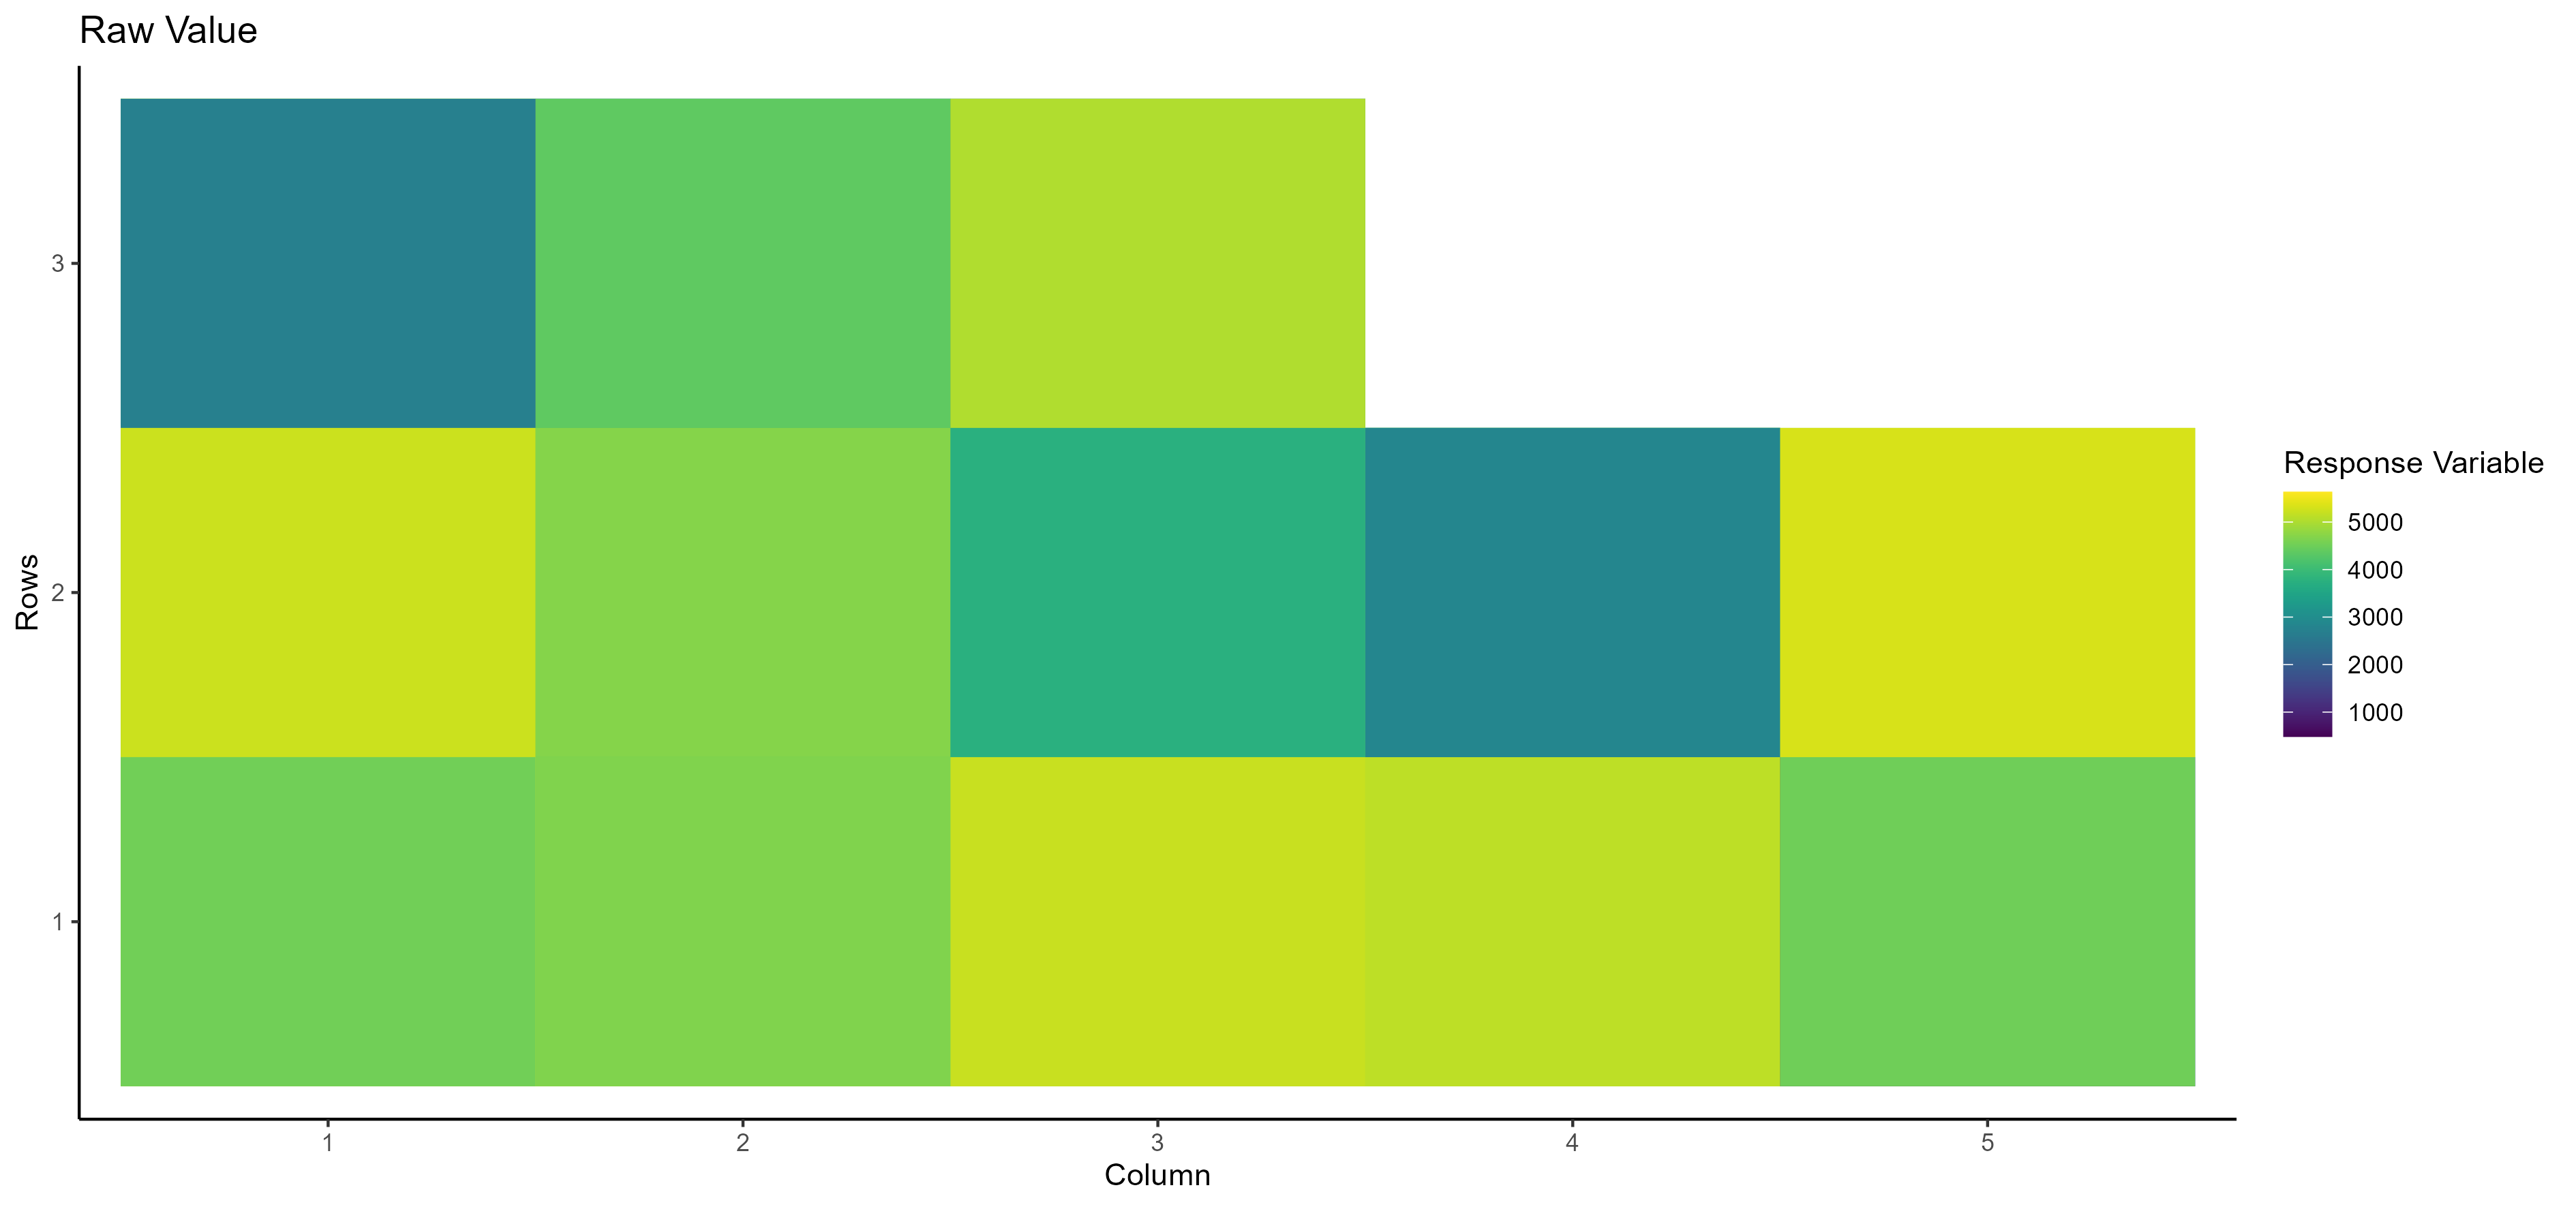
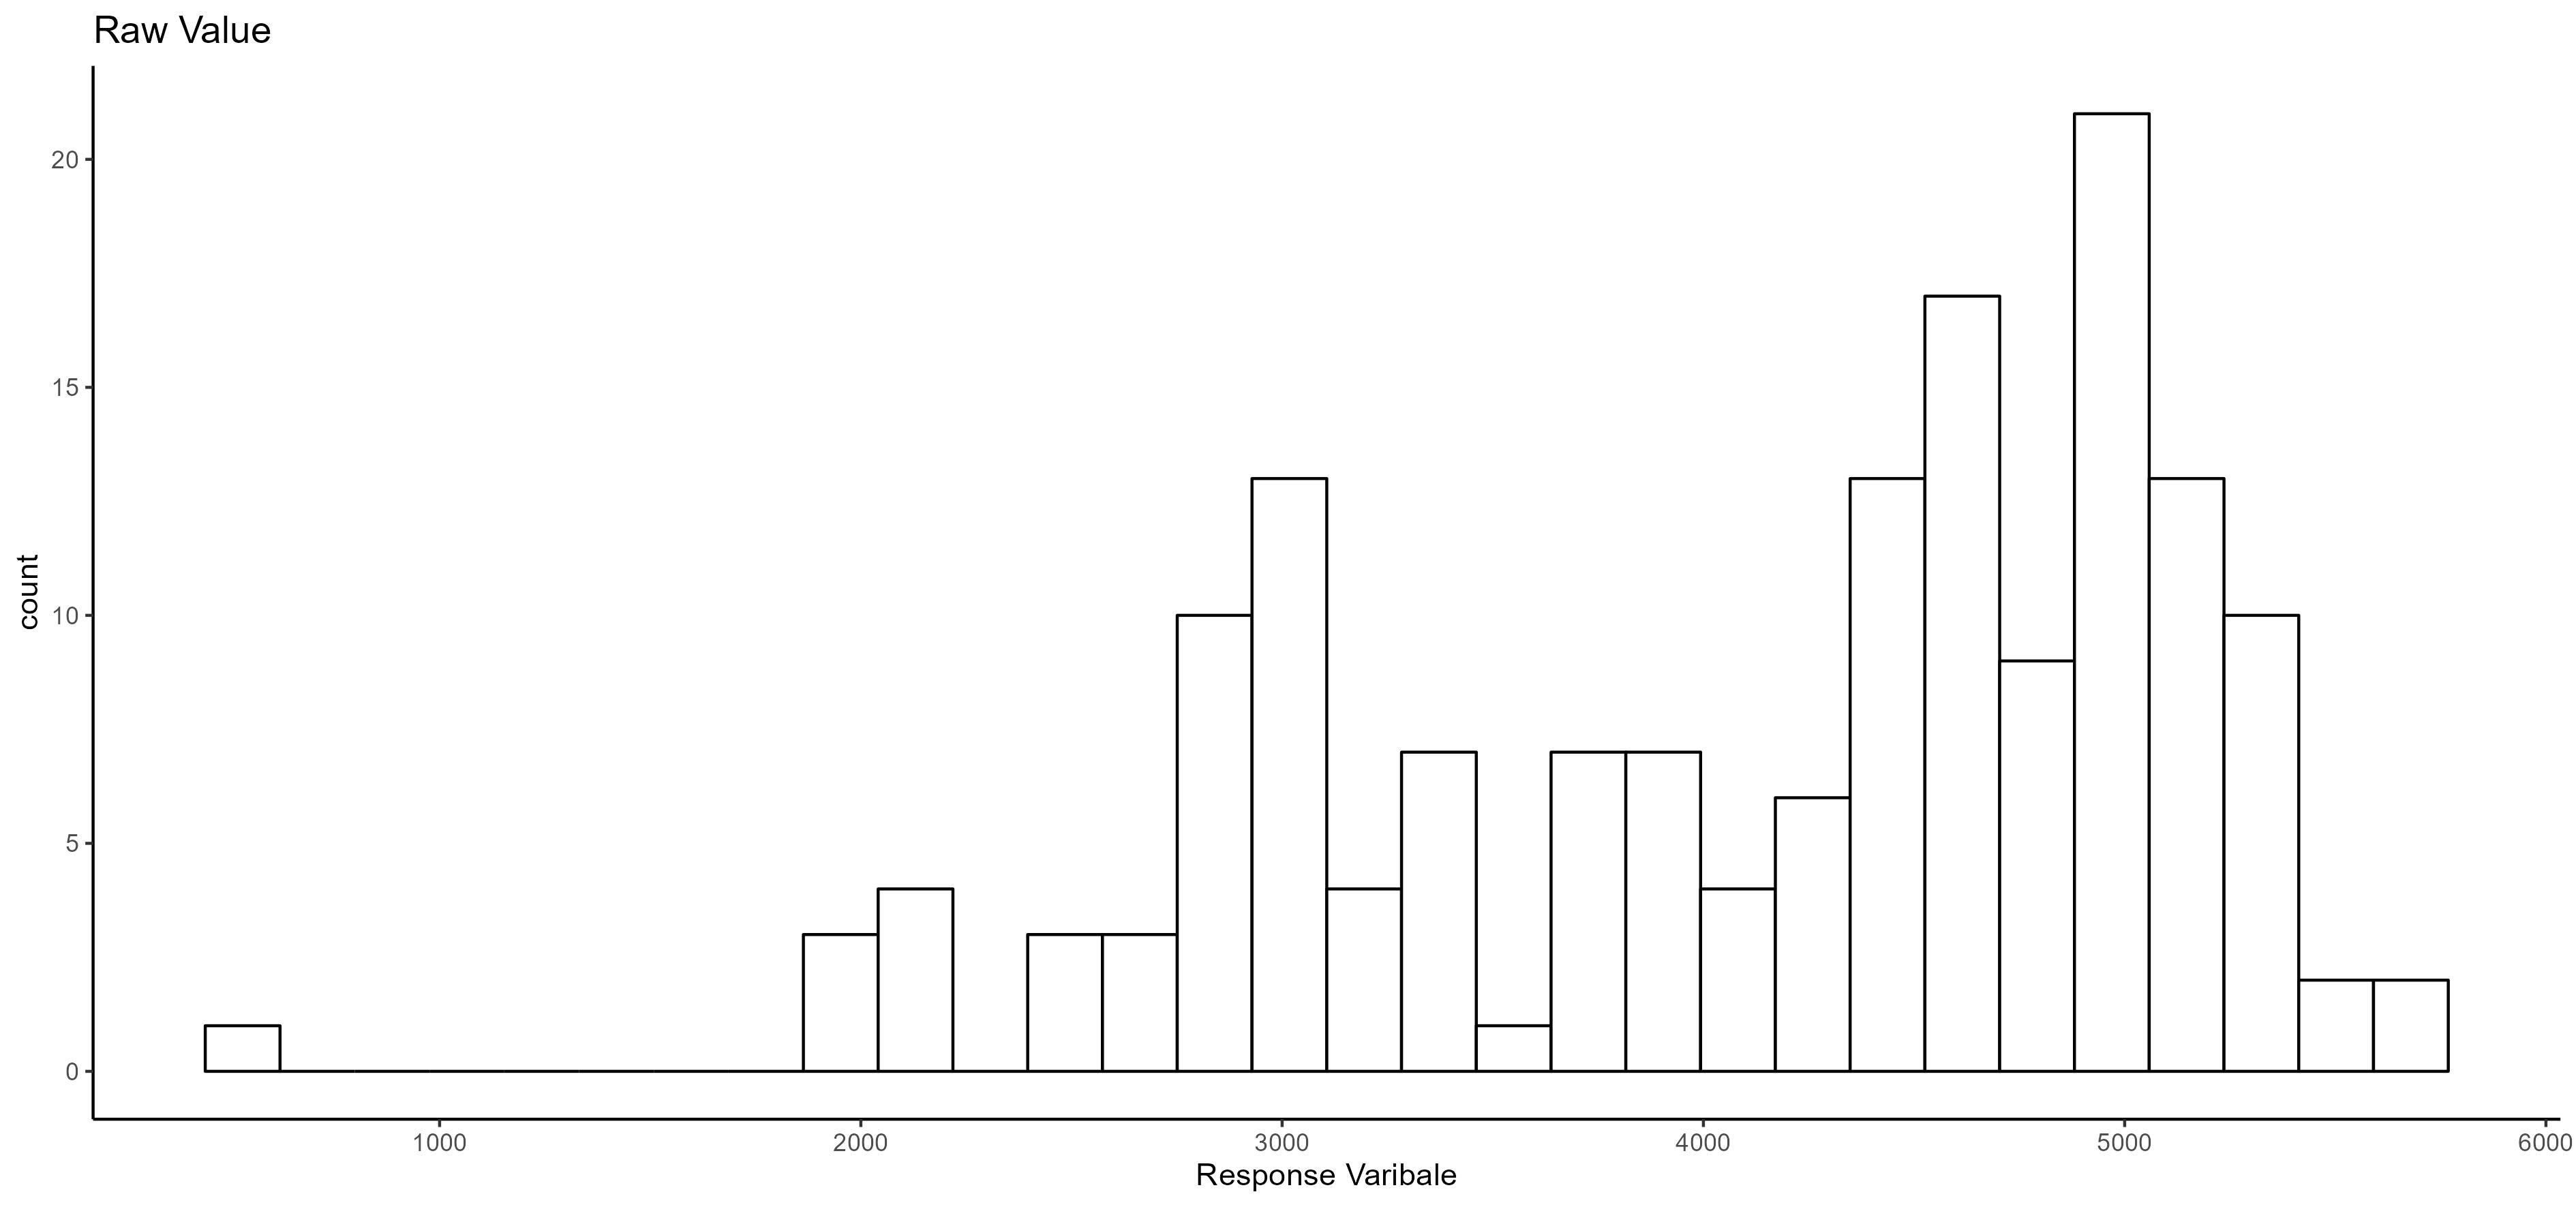
- Raw Value Here, you can see the raw value of the selected dependent/response variable based on the row and column number:
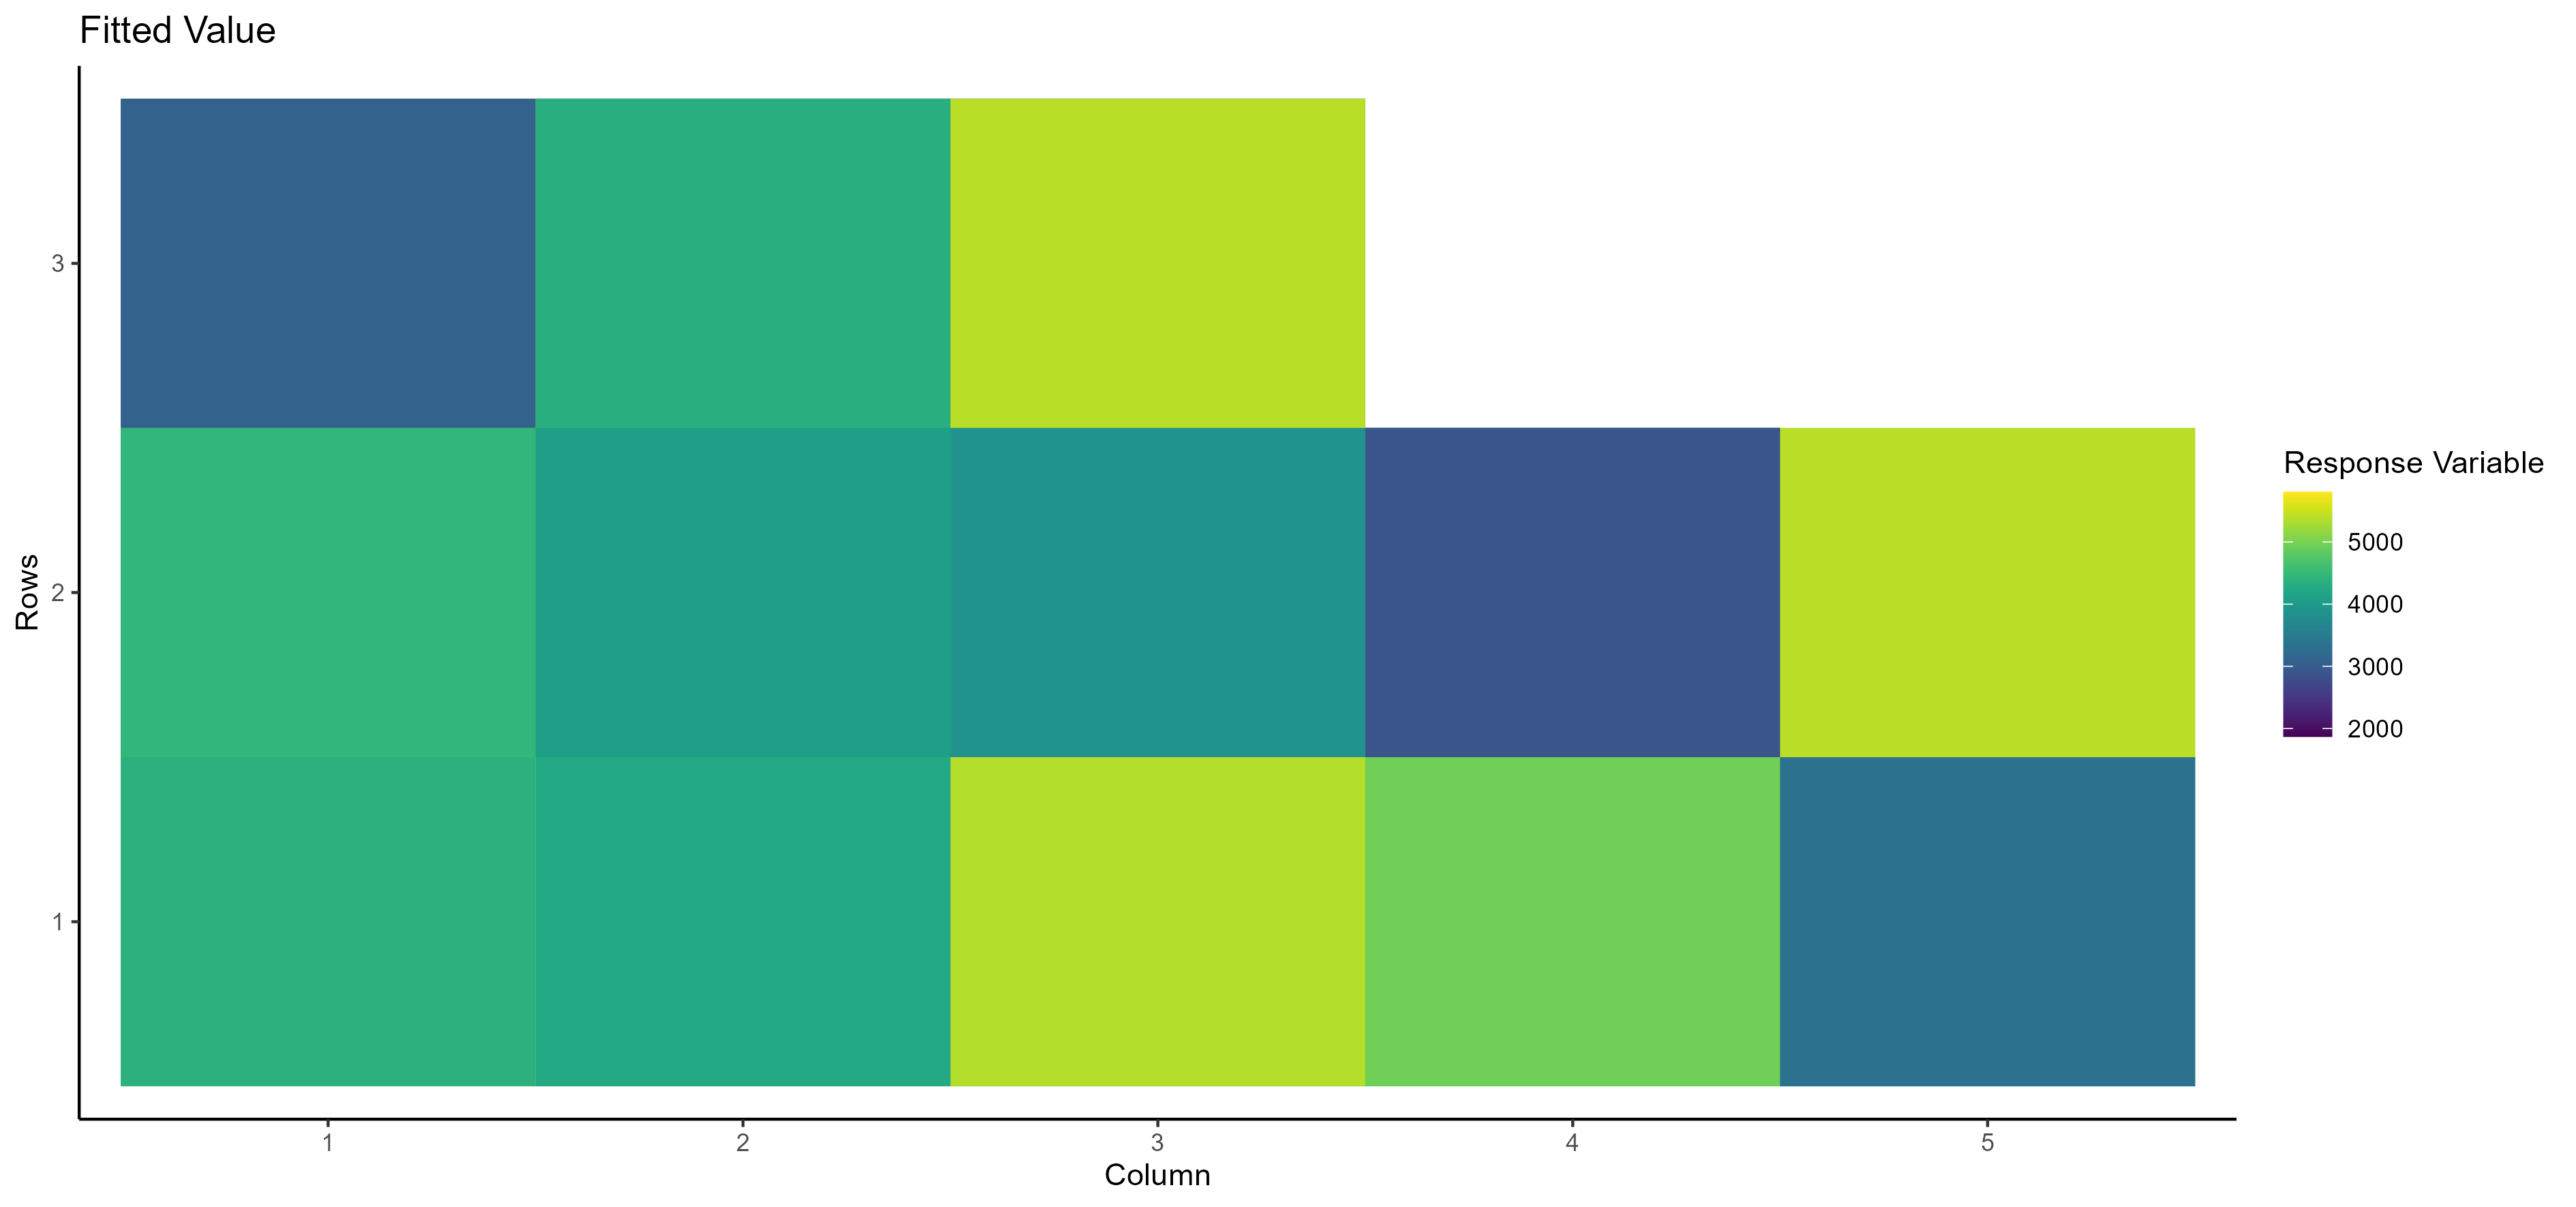
- Fitted Value Here, you can see the fitted value of the selected dependent/response variable based on the row and column number:
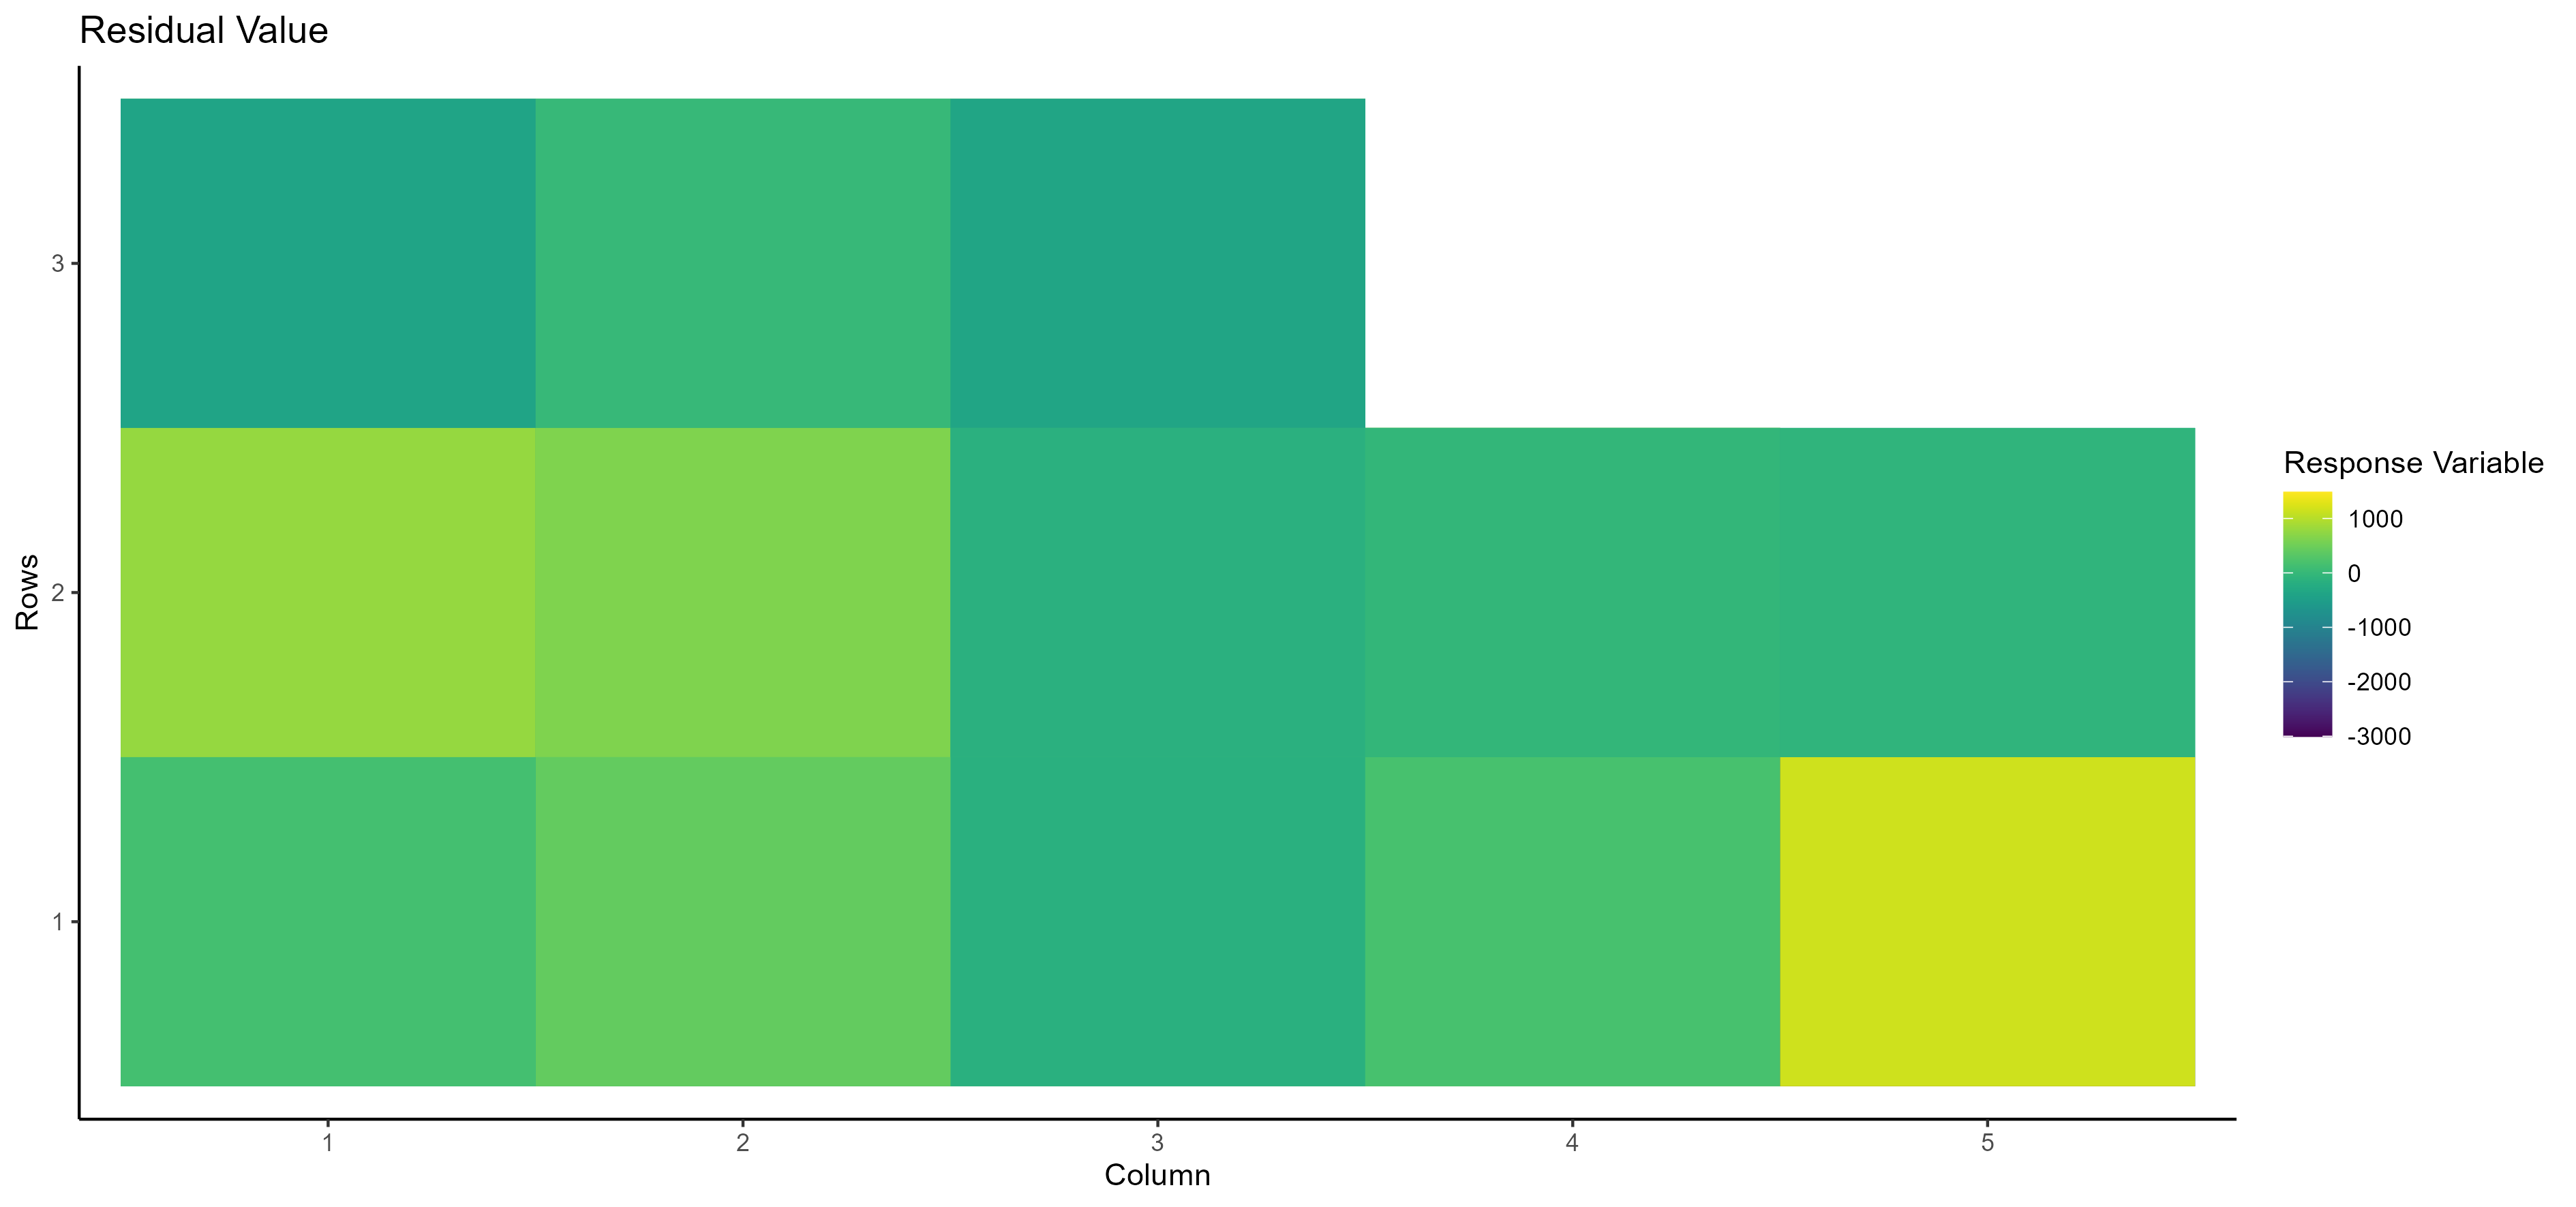
- Residual Value Here, you can see the residual value of the selected dependent/response variable based on the row and column number:
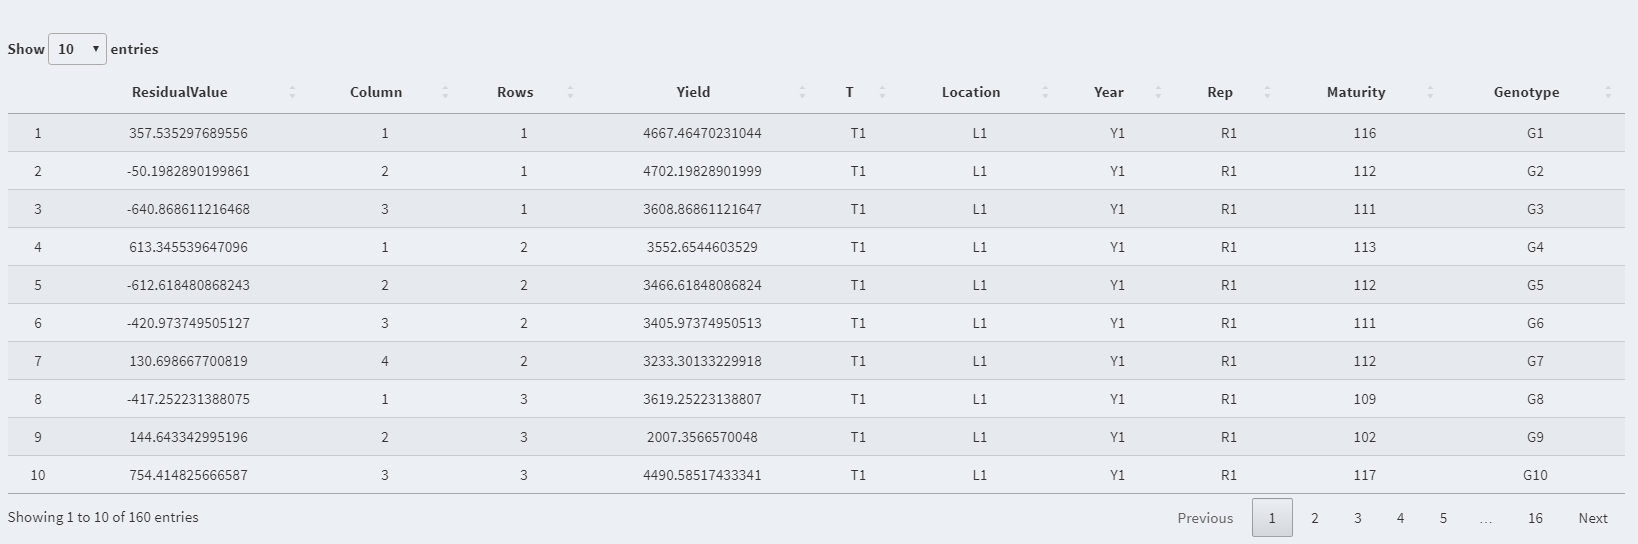
In addition, Spatial analysis results are available in two tables:
- Spatial analysis of the selected dependent/response variable:
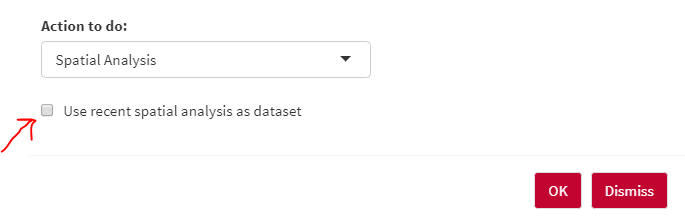
NOTE: You can use the spatial analysis table as the main dataset or use it for mixed analysis/heritability by clicking on the following option:
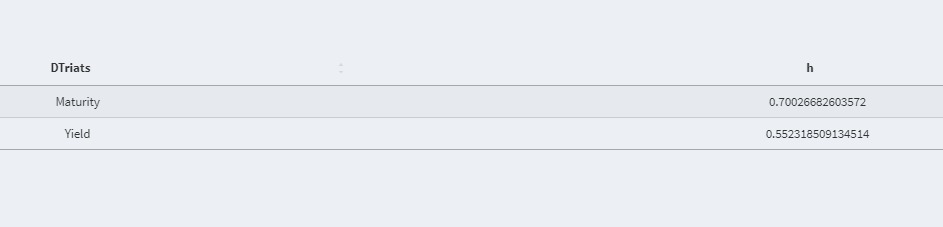
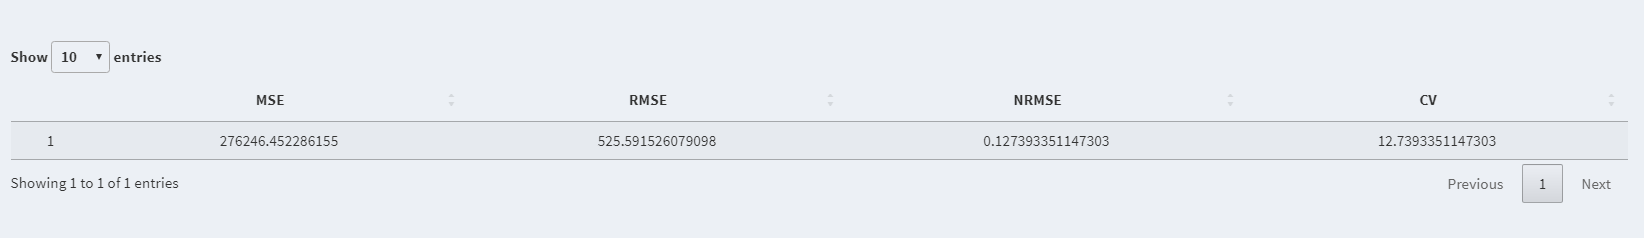
- Spatial analysis parameter dependent/response variable:
Mixed model analysis is known as one of the most commonly used methods in agriculture to analyze the variance of both fixed and random effects.
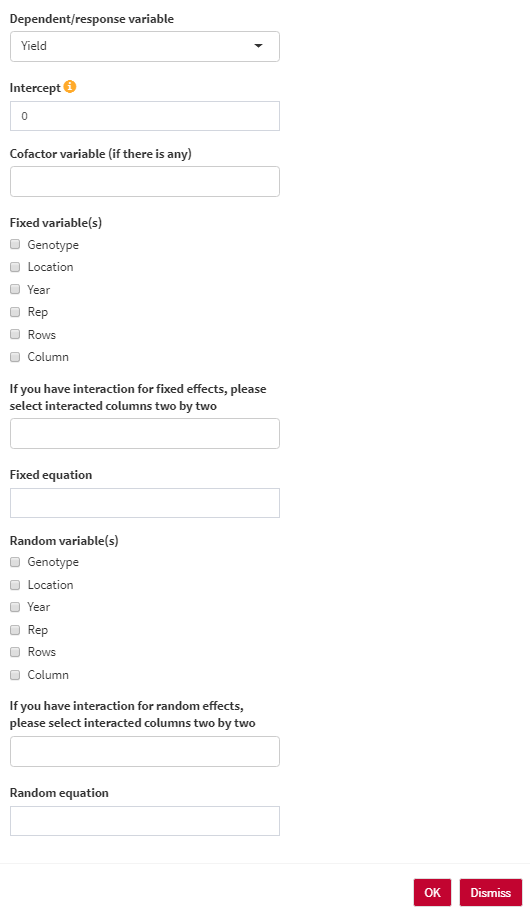
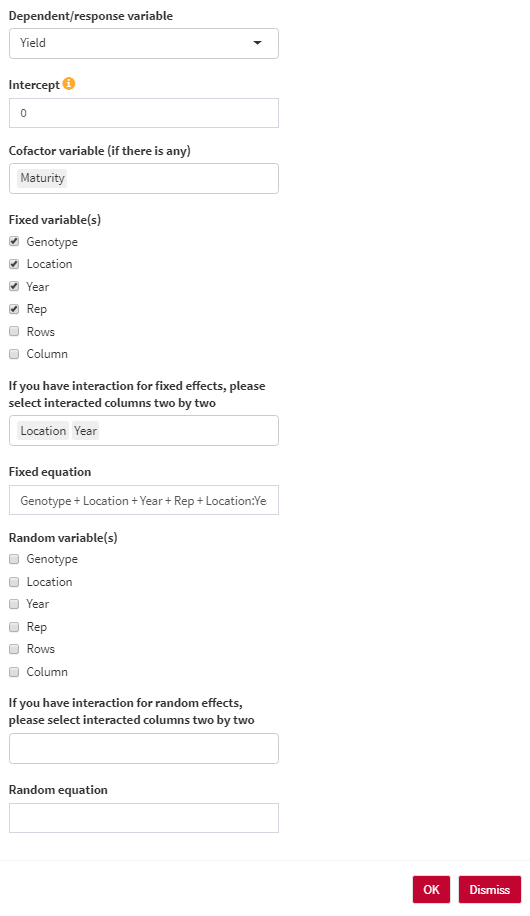
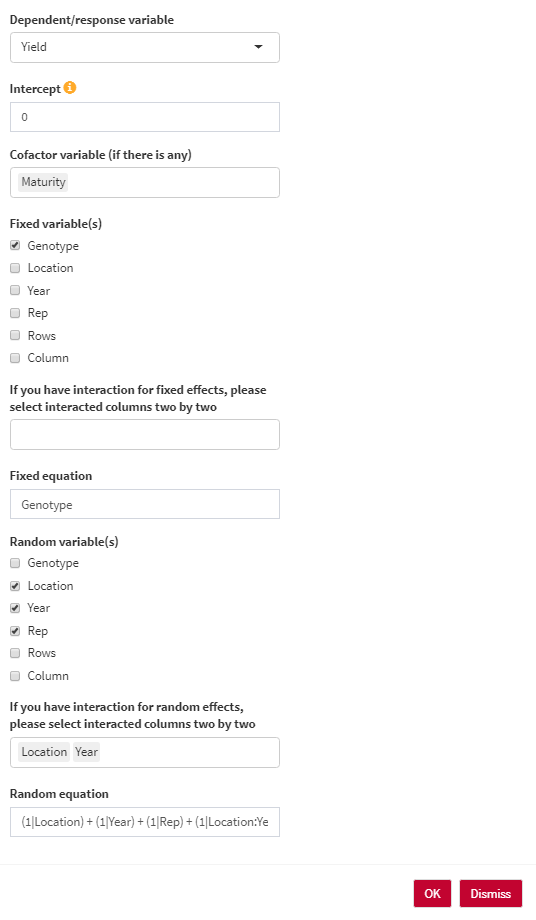
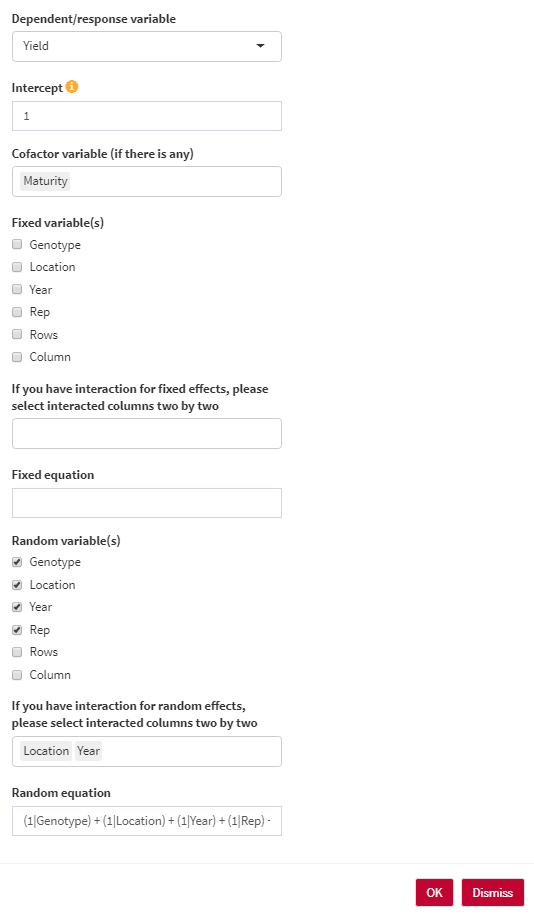
- Dependent/response variable: Select the response variable that you are going to work with.
- Intercept: The intercept parameter can be 1 (with intercept) or 0/-1 (without intercept). For estimating BLUE, the intercept should be 0. For estimating BLUP, the intercept should be 1.
- Cofactor variable (if there is any): You can use any numerical cofactor (One at a time).
- Genotype variable: Select the column containing genotype names.
- Fixed variable(s): Select fixed variables in your analysis.
- If you have interaction for fixed effects; please select interacted columns two by two.
- Fixed equation: the overall shape of the fixed effect equation. You are able to edit the final equation here.
- Random variable(s): Select random variables in your analysis.
- If you have interaction for random effects; please select interacted columns two by two.
- Random equation: the overall shape of the random effect equation. You are able to edit the final equation here.
Here, you have three scenarios for analyzing your data:
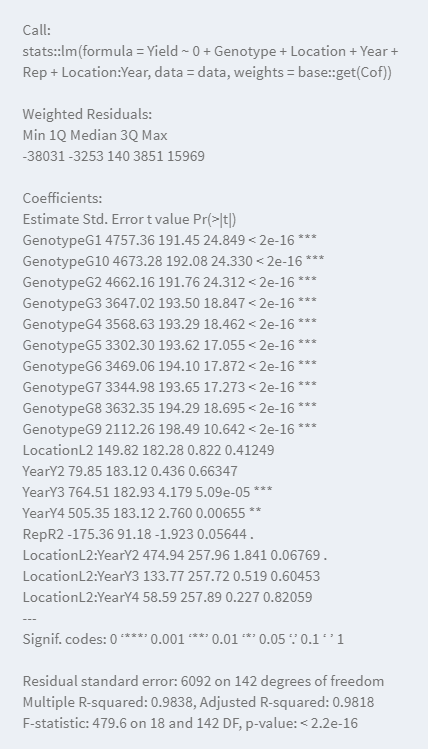
- Summary of the model:
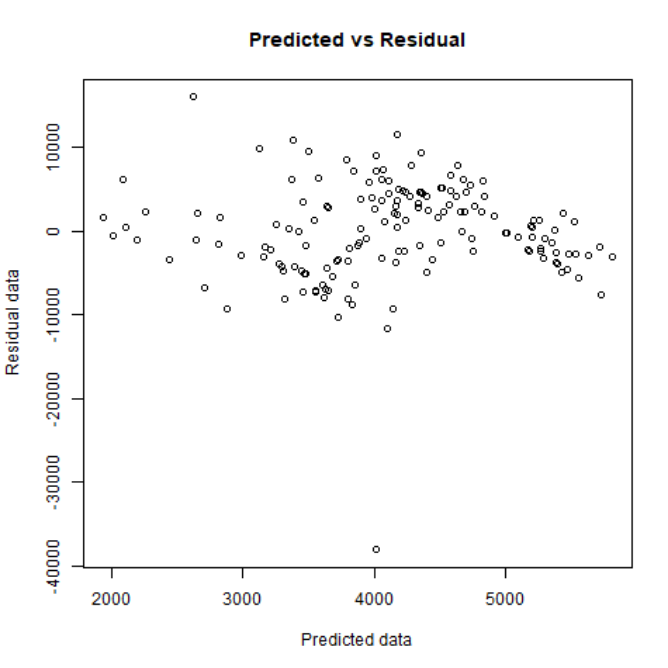
- Predicted vs Residual plot:
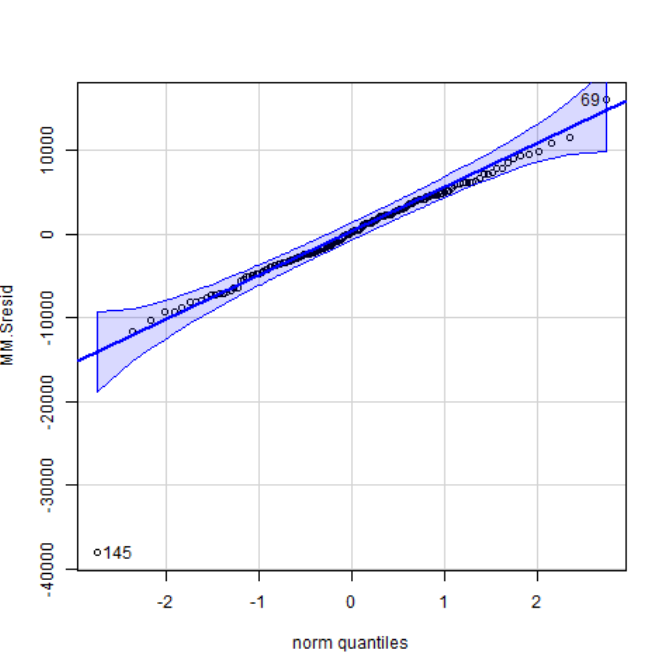
- Quartile plot:
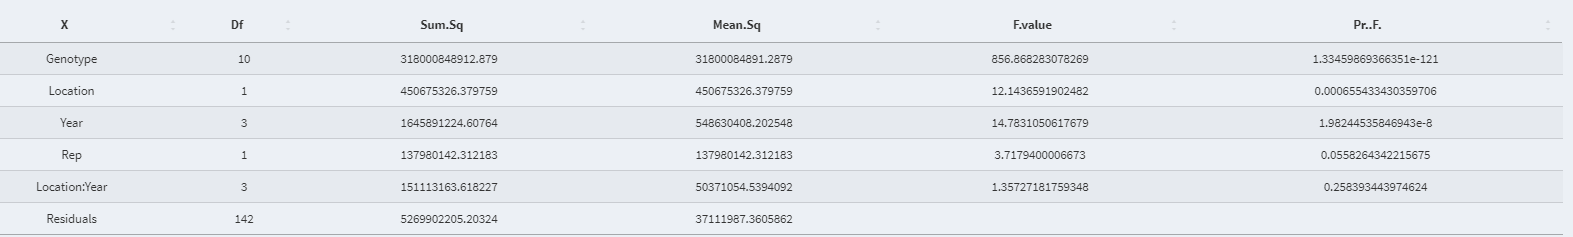
- Full ANOVA table (All fixed):
- Predicted value after extracting residuals for each data point:

- Shapiro Wilk normality test:

In addition to the results mentioned above,
- Normality distribution:
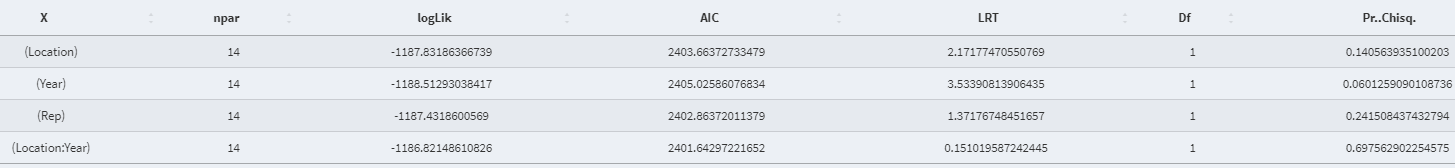
- Anova table (Random effect):
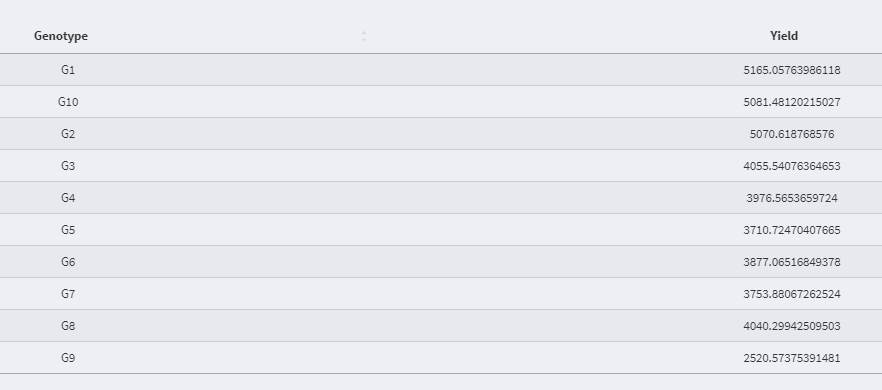
- Best Linear Unbiased Estimator (BLUE) value of the fixed effect variable:
In addition to the summary of the model,
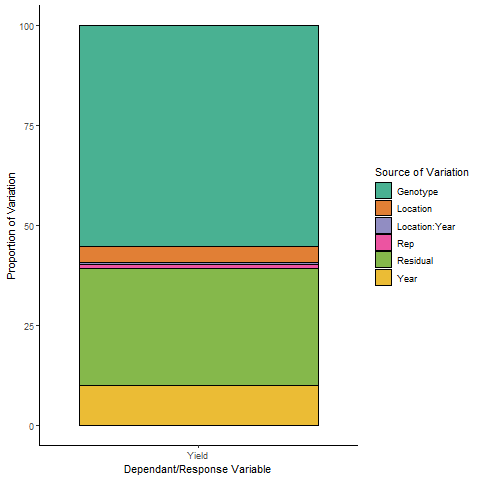
- Variance Proportion (Plot):
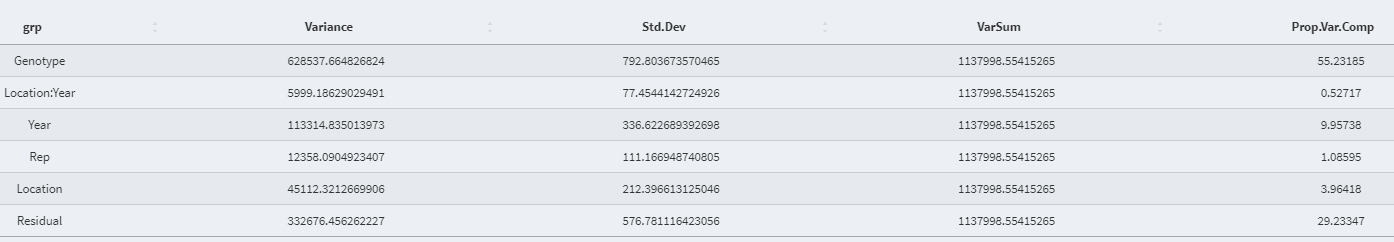
- Variance Proportion (Table):
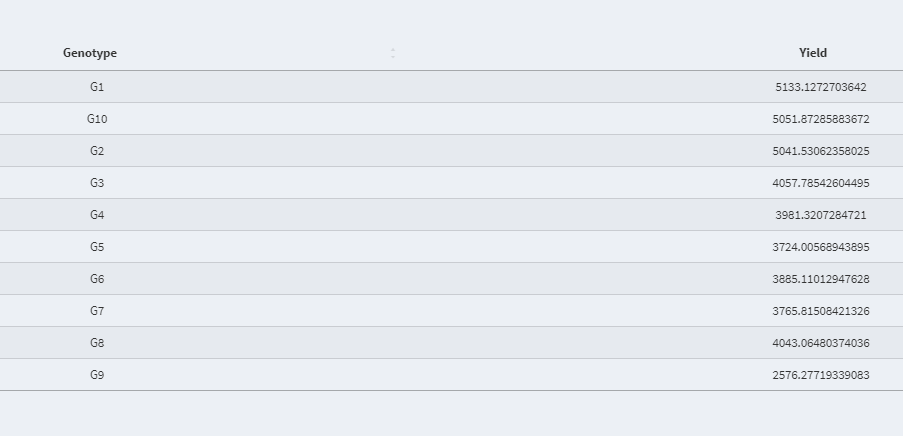
- Best Linear Unbiased Prediction (BLUP) value of the random effect variable:
In the current version of AllInOne, users are able to estimate the broad-sense heritability which is defined as the ratio of genetic variance to phenotypic variance.
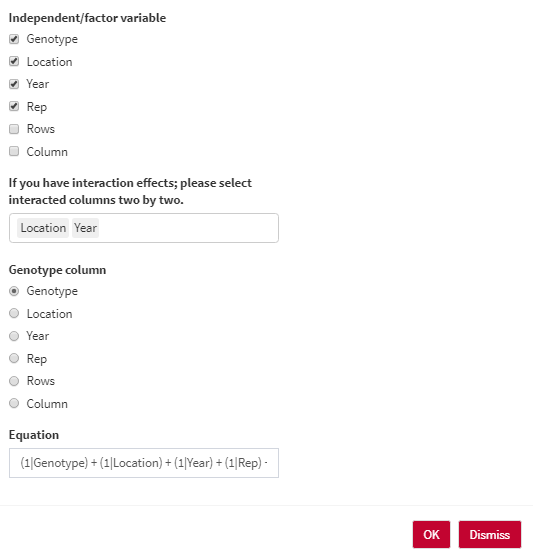
- Independent/factor variable: Select the Independent/factor variables that you would like to have in the heritability equation.
- If you have interaction effects; please select interacted columns two by two.
- Genotype column: Select the column containing genotype names.
- Equation: the overall shape of the heritability equation. You are able to edit the final equation here.
- Heritability (Plot):
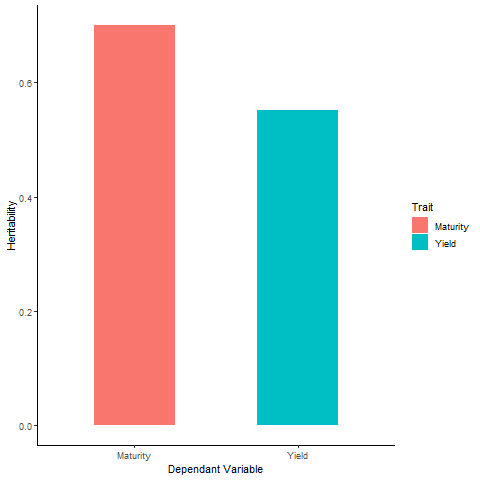
- Heritability (Table):